Engineeringrobo User Guide

Got the VIP membership for EngineeringRobo. What is next?
July 24, 2018
Testimonials
July 24, 2018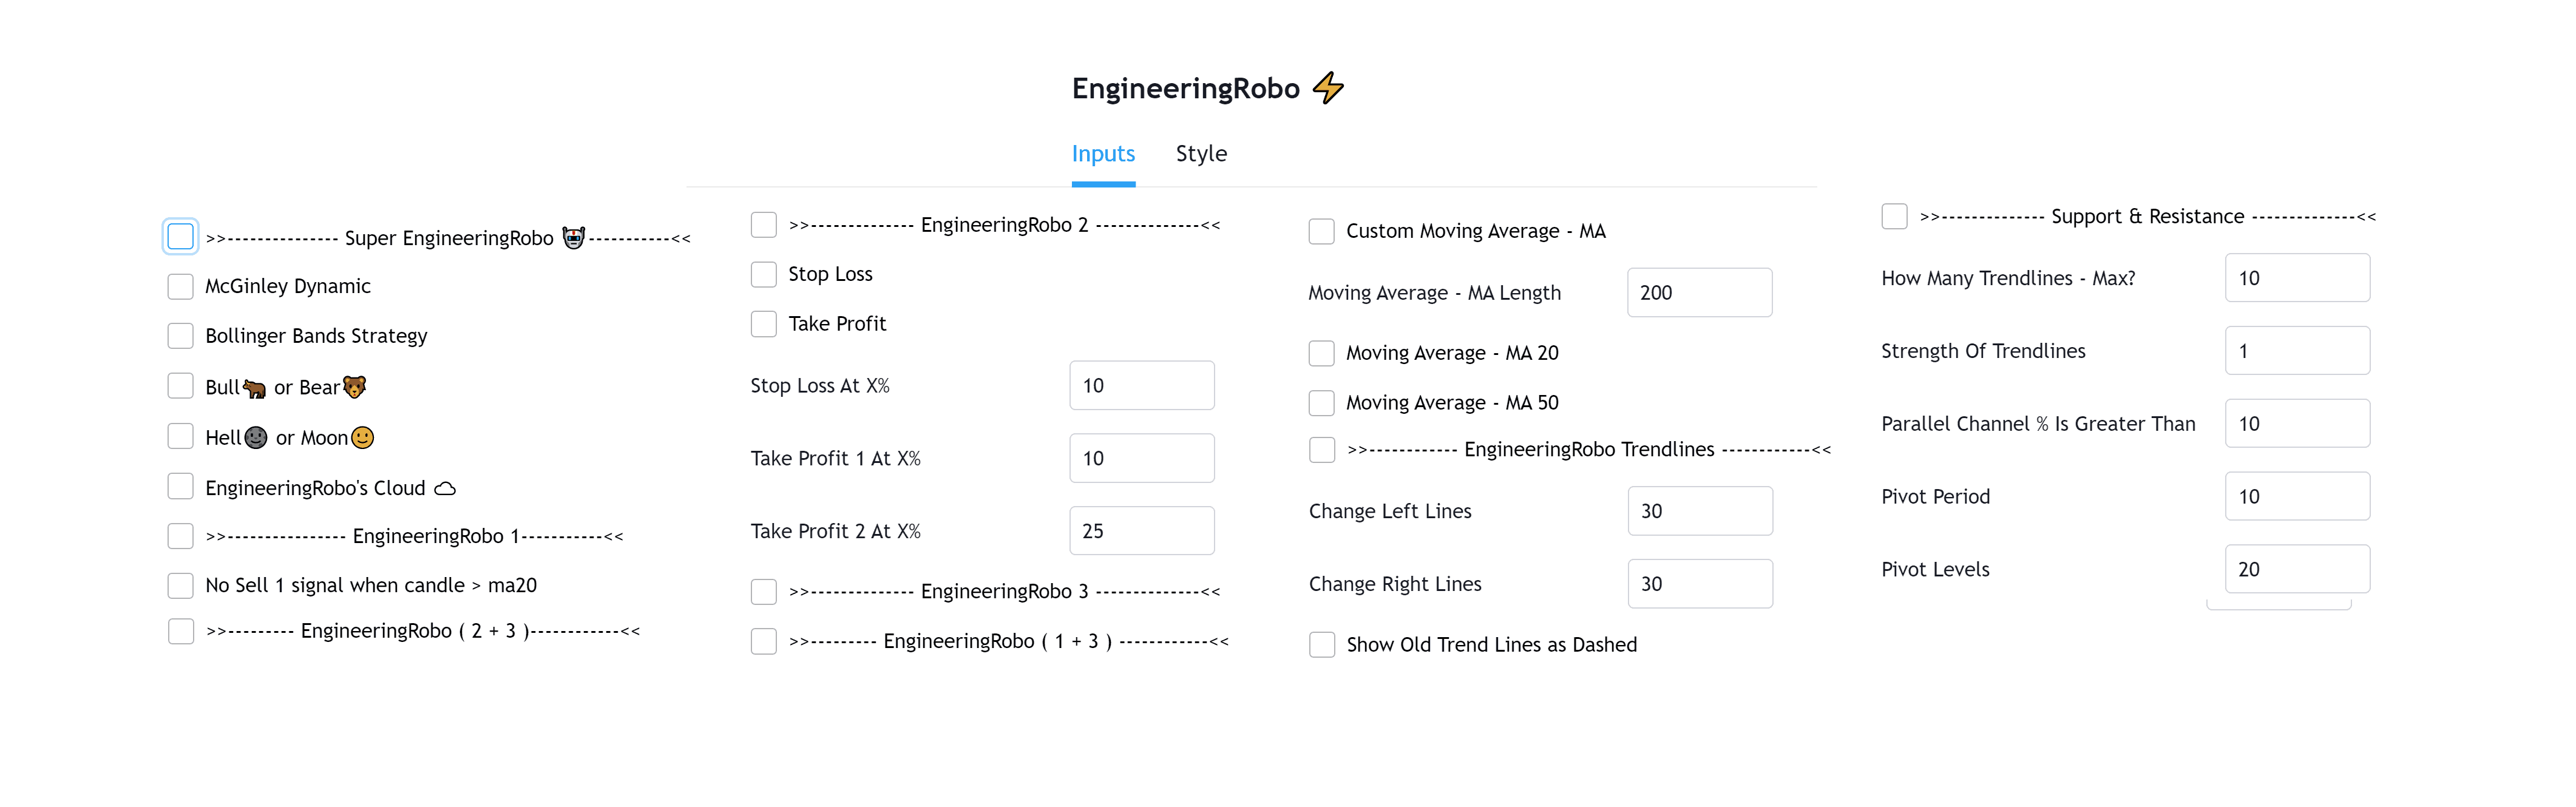
EngineeringRobo user guide
1. Login to TradingView.com
2. From the homepage, click on ‘Chart’ in the top navigation bar
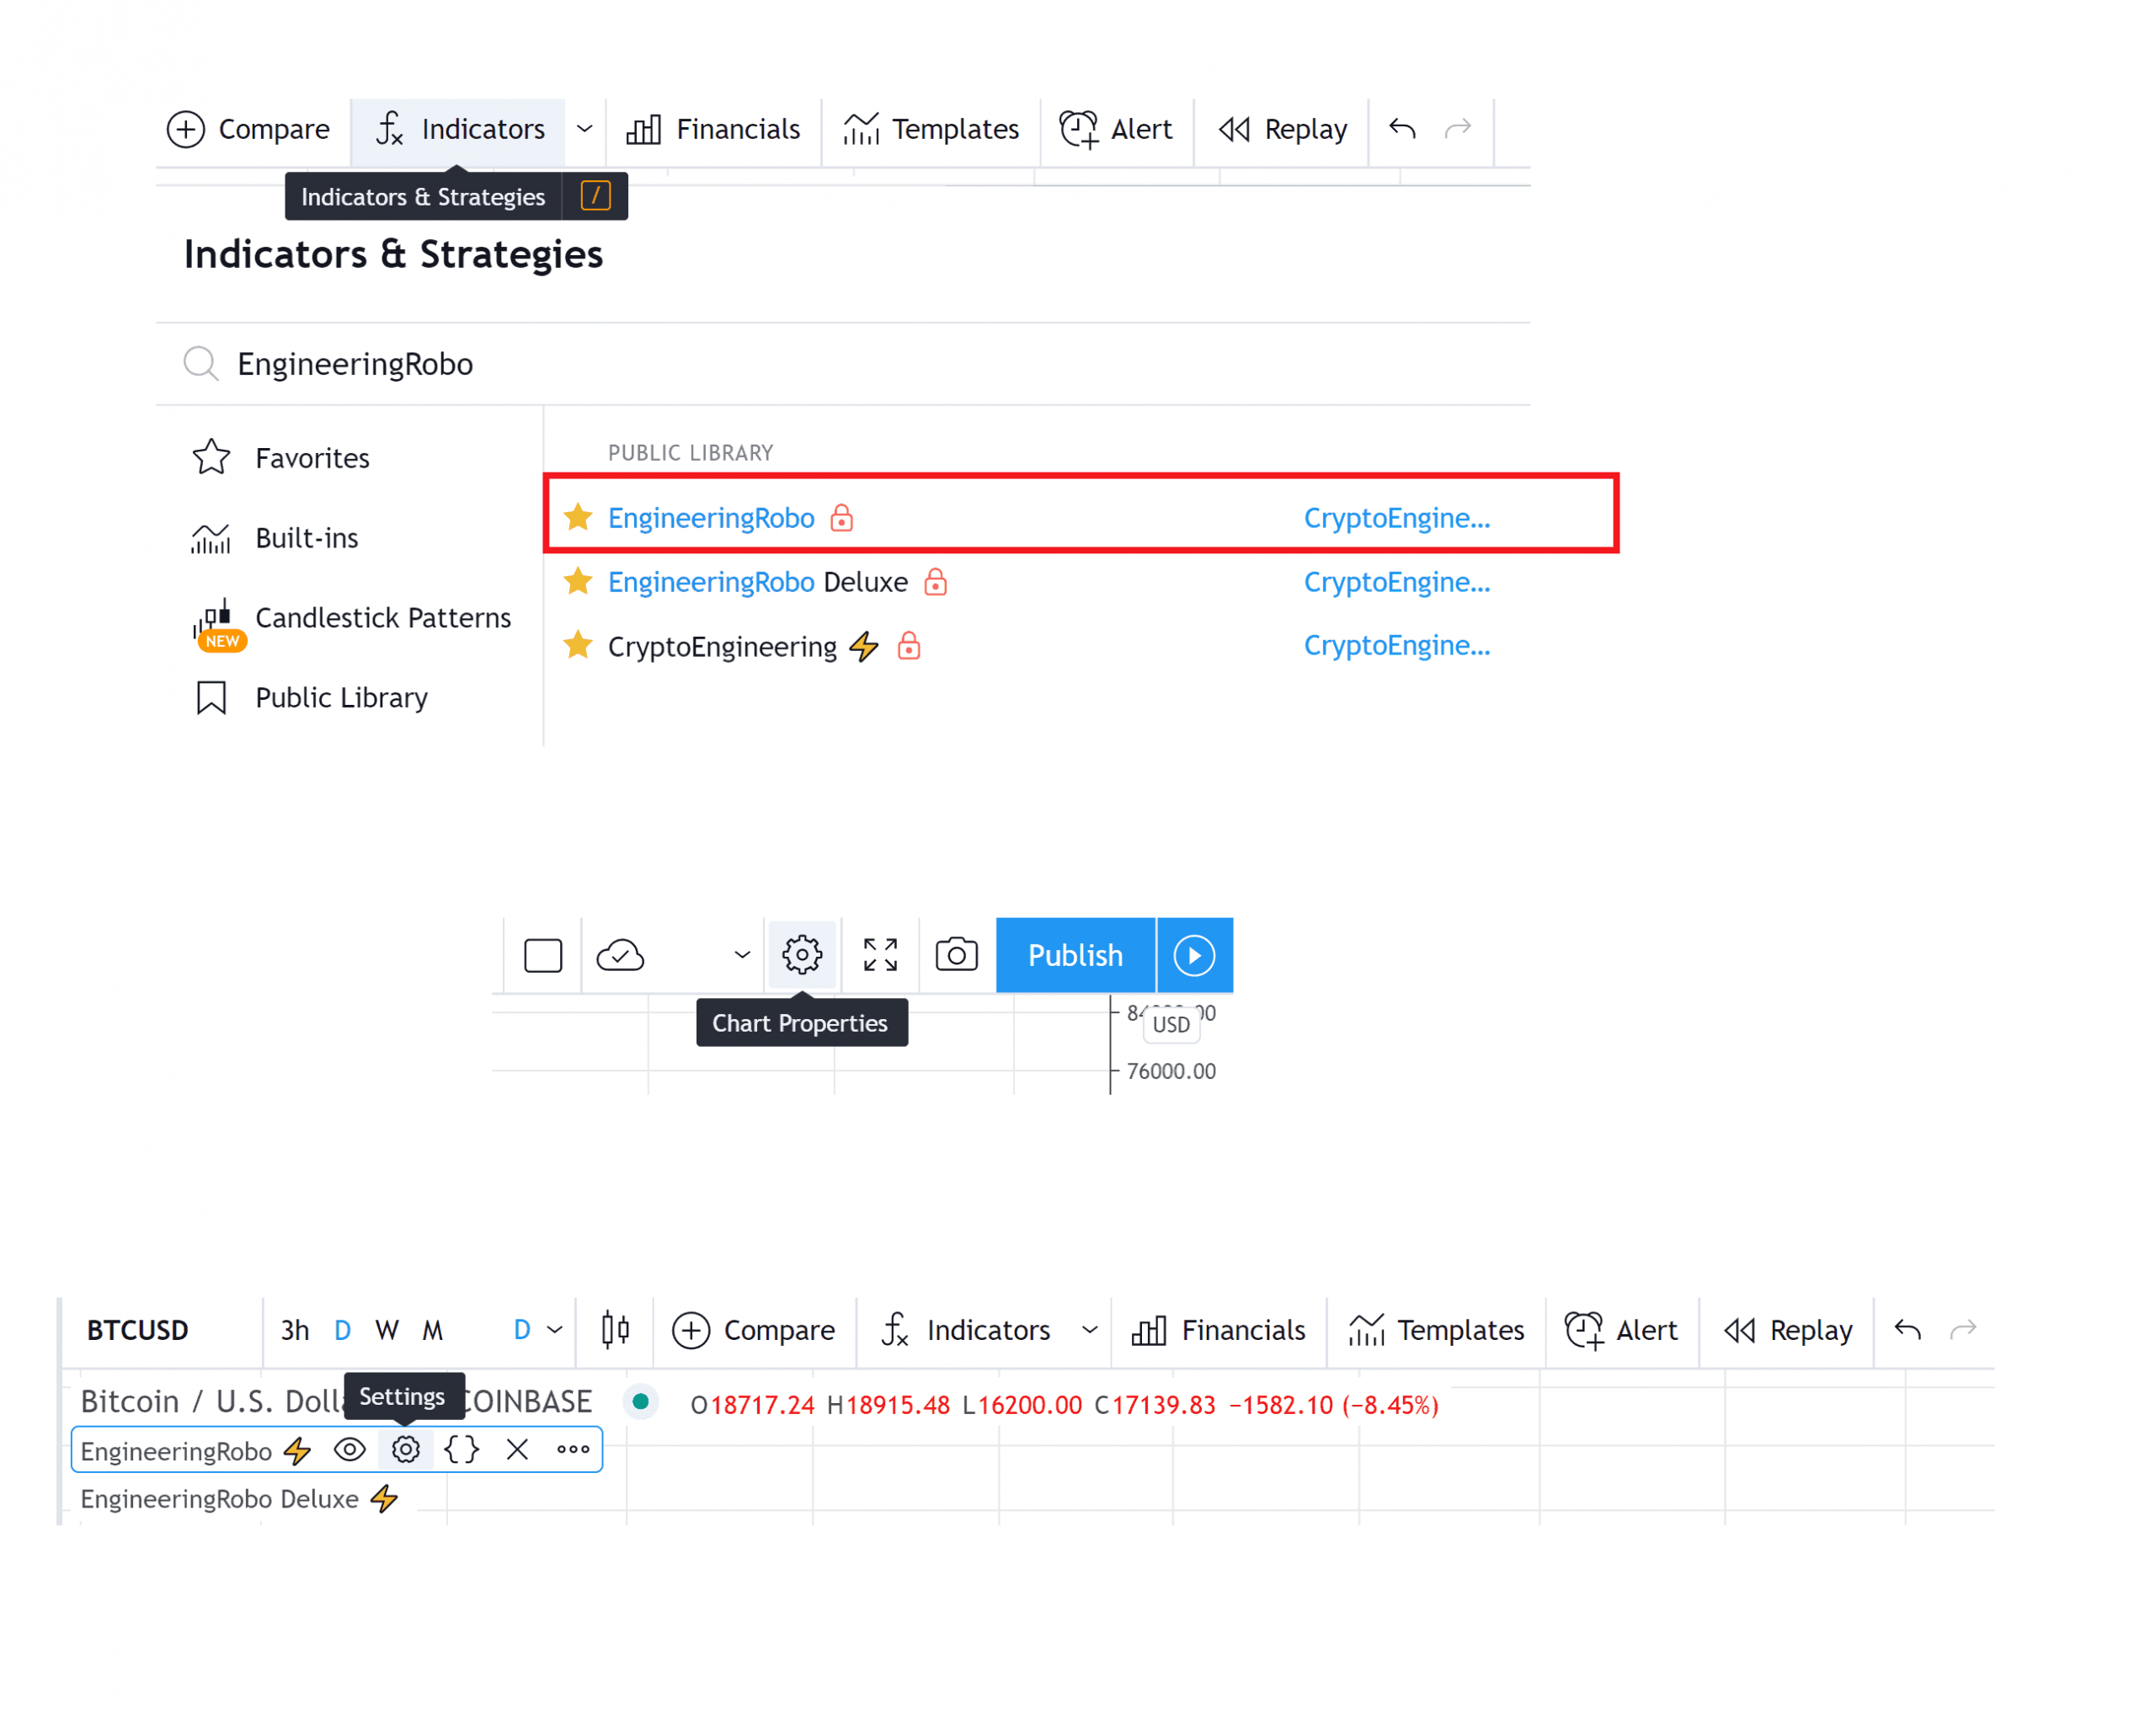
3. Select “Indicators” on the top-center-middle panel
4. In the indicator library, type "EngineeringRobo" The indicator will be added to your chart after It is approved by EngineeringRobo Team. Please " contact " us if you have any issues
5. After you are approved by EngineeringRobo Team, 7 different trading robots in EngineeringRobo will provide you entry & exit ideas 24/7
2. From the homepage, click on ‘Chart’ in the top navigation bar
3. Select “Indicators” on the top-center-middle panel
4. In the indicator library, type "EngineeringRobo" The indicator will be added to your chart after It is approved by EngineeringRobo Team. Please " contact " us if you have any issues
5. After you are approved by EngineeringRobo Team, 7 different trading robots in EngineeringRobo will provide you entry & exit ideas 24/7
5. After you are approved by EngineeringRobo Team, 7 different trading robots in EngineeringRobo will provide you entry & exit ideas 24/7

After you get approved by EngineeringRobo Team, you might see some numbers beside "EngineeringRobo ⚡️" .
Go to chart properties on the top left, the chart setting will pop up, you can click the status line. Remove the check mark on the Indicator Arguments & Values. Easy and Clean!
Beside " EngineeringRobo ⚡️" There are " Hide & Settings" buttons.
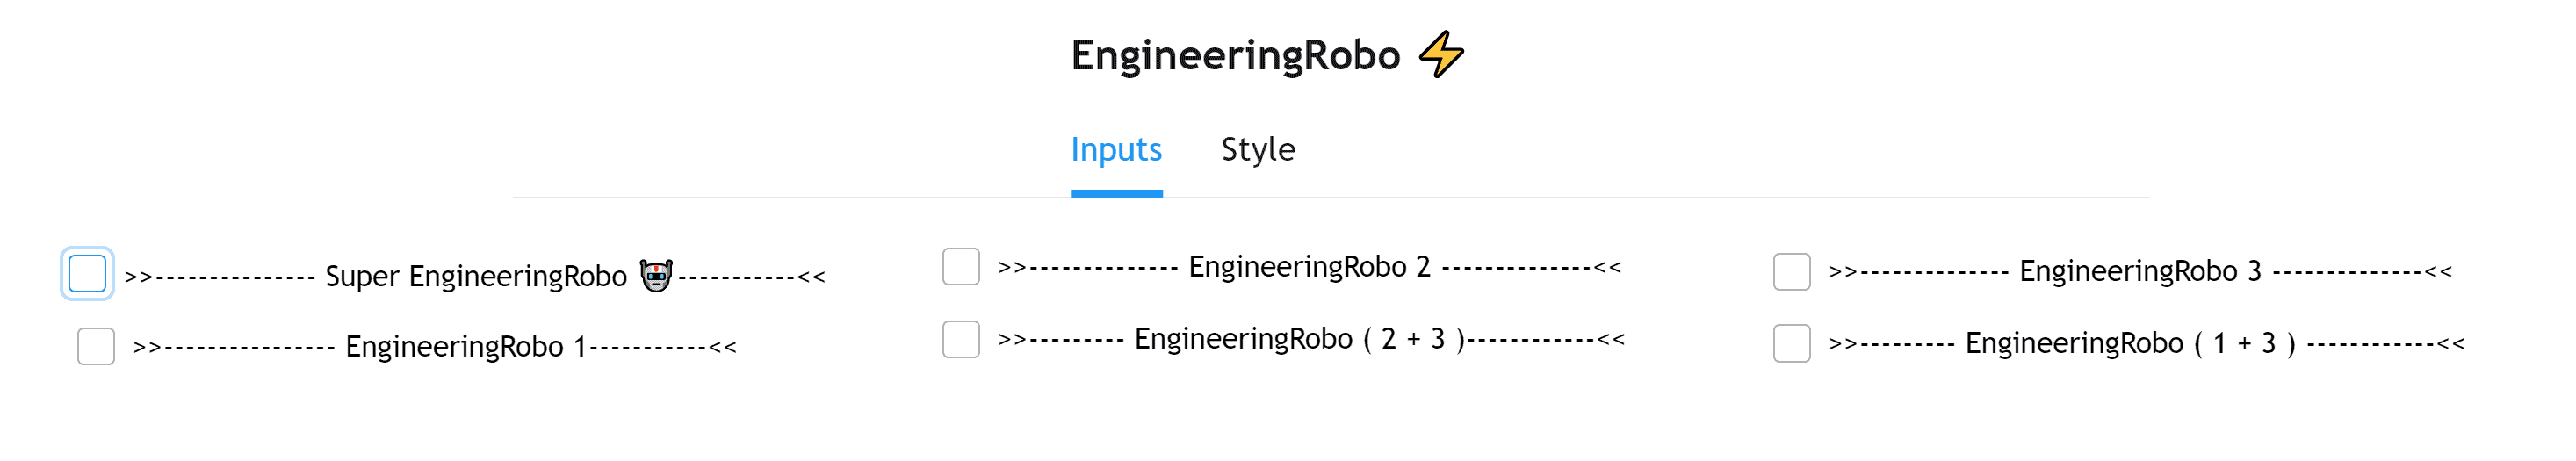
When you click on the settings, you can open or close any indicators on the inputs.
Engineering Robo is an "Invite & Paid only" indicator that can be added to any chart on tradingview.
Go to chart properties on the top left, the chart setting will pop up, you can click the status line. Remove the check mark on the Indicator Arguments & Values. Easy and Clean!
Beside " EngineeringRobo ⚡️" There are " Hide & Settings" buttons.
When you click on the settings, you can open or close any indicators on the inputs.
Engineering Robo is an "Invite & Paid only" indicator that can be added to any chart on tradingview.
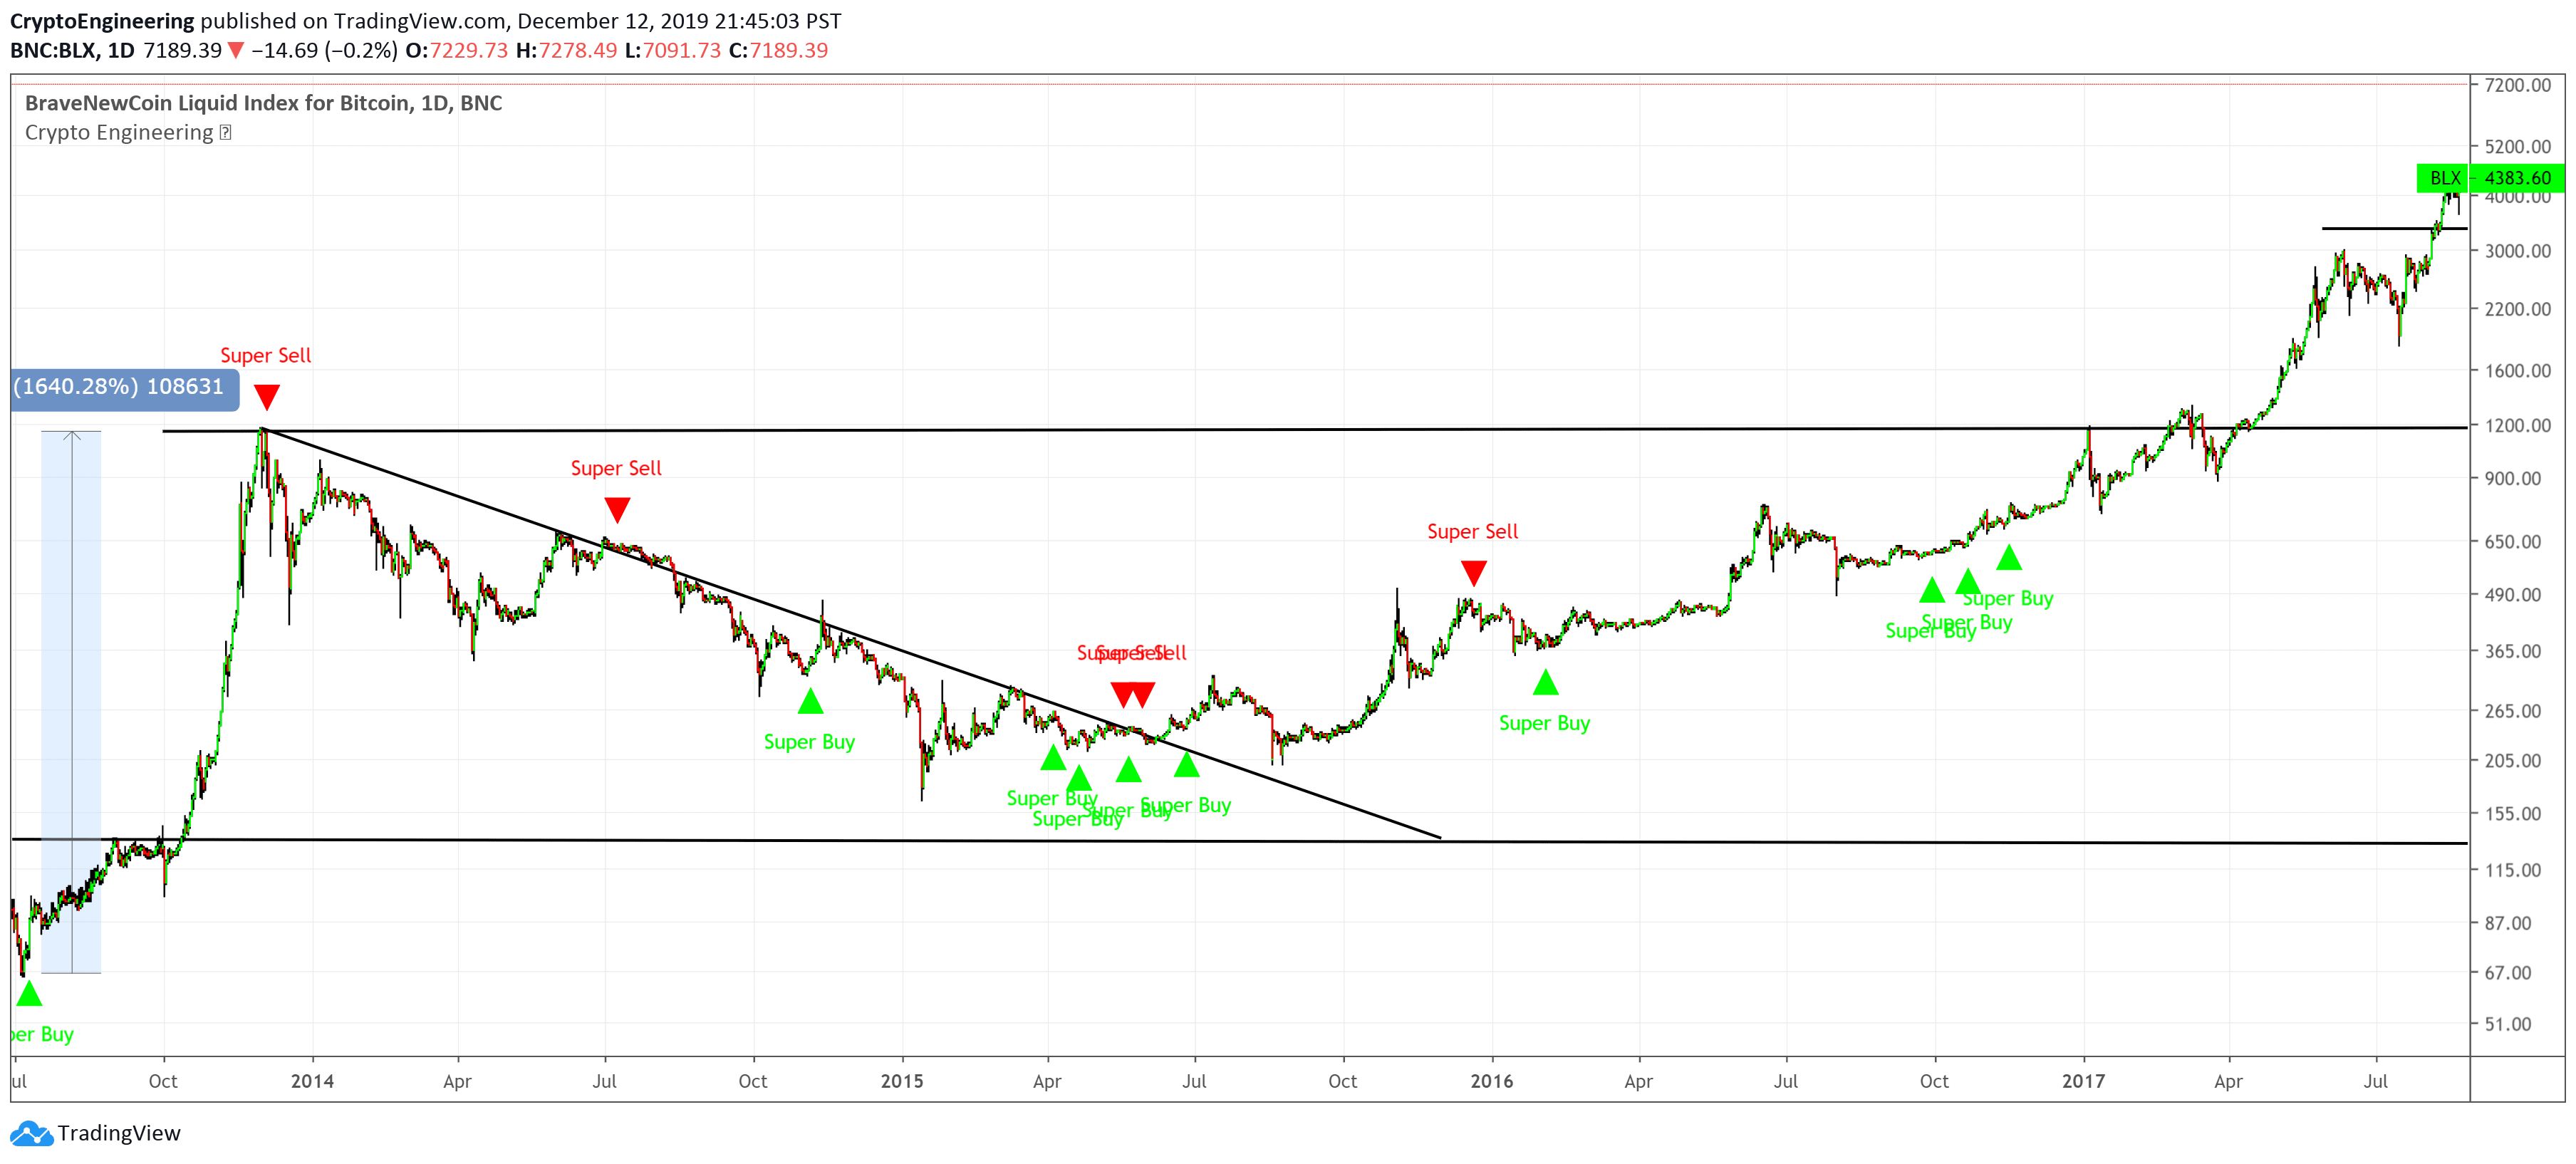
When you click the settings, the first indicator is " Super EngineeringRobo ". It generates "Super Buy and Super Sell " signals on the chart. If you are buying at Super Buy, you should not wait until Super Sell to sell it, you can sell it at either Sell 1 or Sell 2. If you are selling at Super Sell, you should not wait for Super Buy to buy it, you can buy it with either Buy 1 or Buy 2.
Below Super Buy & Sell ,there is a McGinley Dynamic. If you open it, "The magic line" will be shown on the chart. It looks like a moving average line, and minimizes price separation, price whipsaws, and hugs prices much more closely. And it does this automatically as a factor of its formula. As long as the candles are above this line, the bullish market is continuing.
Engineering's Robo Cloud is a simple indicator and inspired from Ichimoku cloud. It's a unique formula. As long as the " green " cloud continue, trend goes up!
No need to hurry to sell until you see the " red " cloud. Run away when you see red cloud!
The next one is "Bollinger Bands Strategy". When stock prices continually touch the upper Bollinger Band, the prices are thought to be overbought; conversely, when they continually touch the lower band, prices are thought to be oversold, triggering a buy signal. EngineeringRobo also creates its own unique BB Buy and BB Sell signals. If you buy with BB Buy, No need to wait for BB Sell to sell it. Vice Versa.
Below the " EngineeringRobo's cloud ", you will see " EngineeringRobo 1" , as long as you open it "Buy 1 & Sell 1 " will be shown on the chart. These signals also depending on the 1 condition below, you can also change these condition anytime to customize the signals. Example, the Robo will not create a " Sell 1 " signal if the condition " No Sell 1 signal when the candle is above Moving Average 20 " is active.
It is time to meet with the most popular robo, it is " EngineeringRobo 2 ". Over 350 members love to use this robo on all their charts. If it is active, "Buy 2 & Sell 2 " will be shown on the chart.
It is time to know " EngineeringRobo 3 " which is one of the most successful indicators in the backtest results. It has been creating " Buy 3 & Sell 3 " signals on charts if it is active. When you see this indicator, you should consider to its recommendation.
" EngineeringRobo (1 + 3 ) and EngineeringRobo ( 2 + 3 ) " conditions are just below EngineeringRobo 3. If a candle gets two signals at the same time, one signal covers another signal. By keep opening these checkboxes are helping you not the miss any signals from Robo 1, Robo 2 and Robo 3.
Below conditions, you will see "Moving Averages ". There are MA 20, 50 and custom MA ( Moving Average ). The 50 moving average ( 50MA ) is the medium term outlook. The 200 moving average ( 200MA ) is the trend bias.
50 And 200 Day Moving Average Rules
Trend reversal (downtrend to uptrend) - MA 50 crossover MA 200 from below.
Trend reversal (uptrend to downtrend) - MA 50 crossover MA 200 from above.
Weekly open –close above MA 20 ( bullish trend )
Weekly open –close below MA 50 ( Bearish trend )
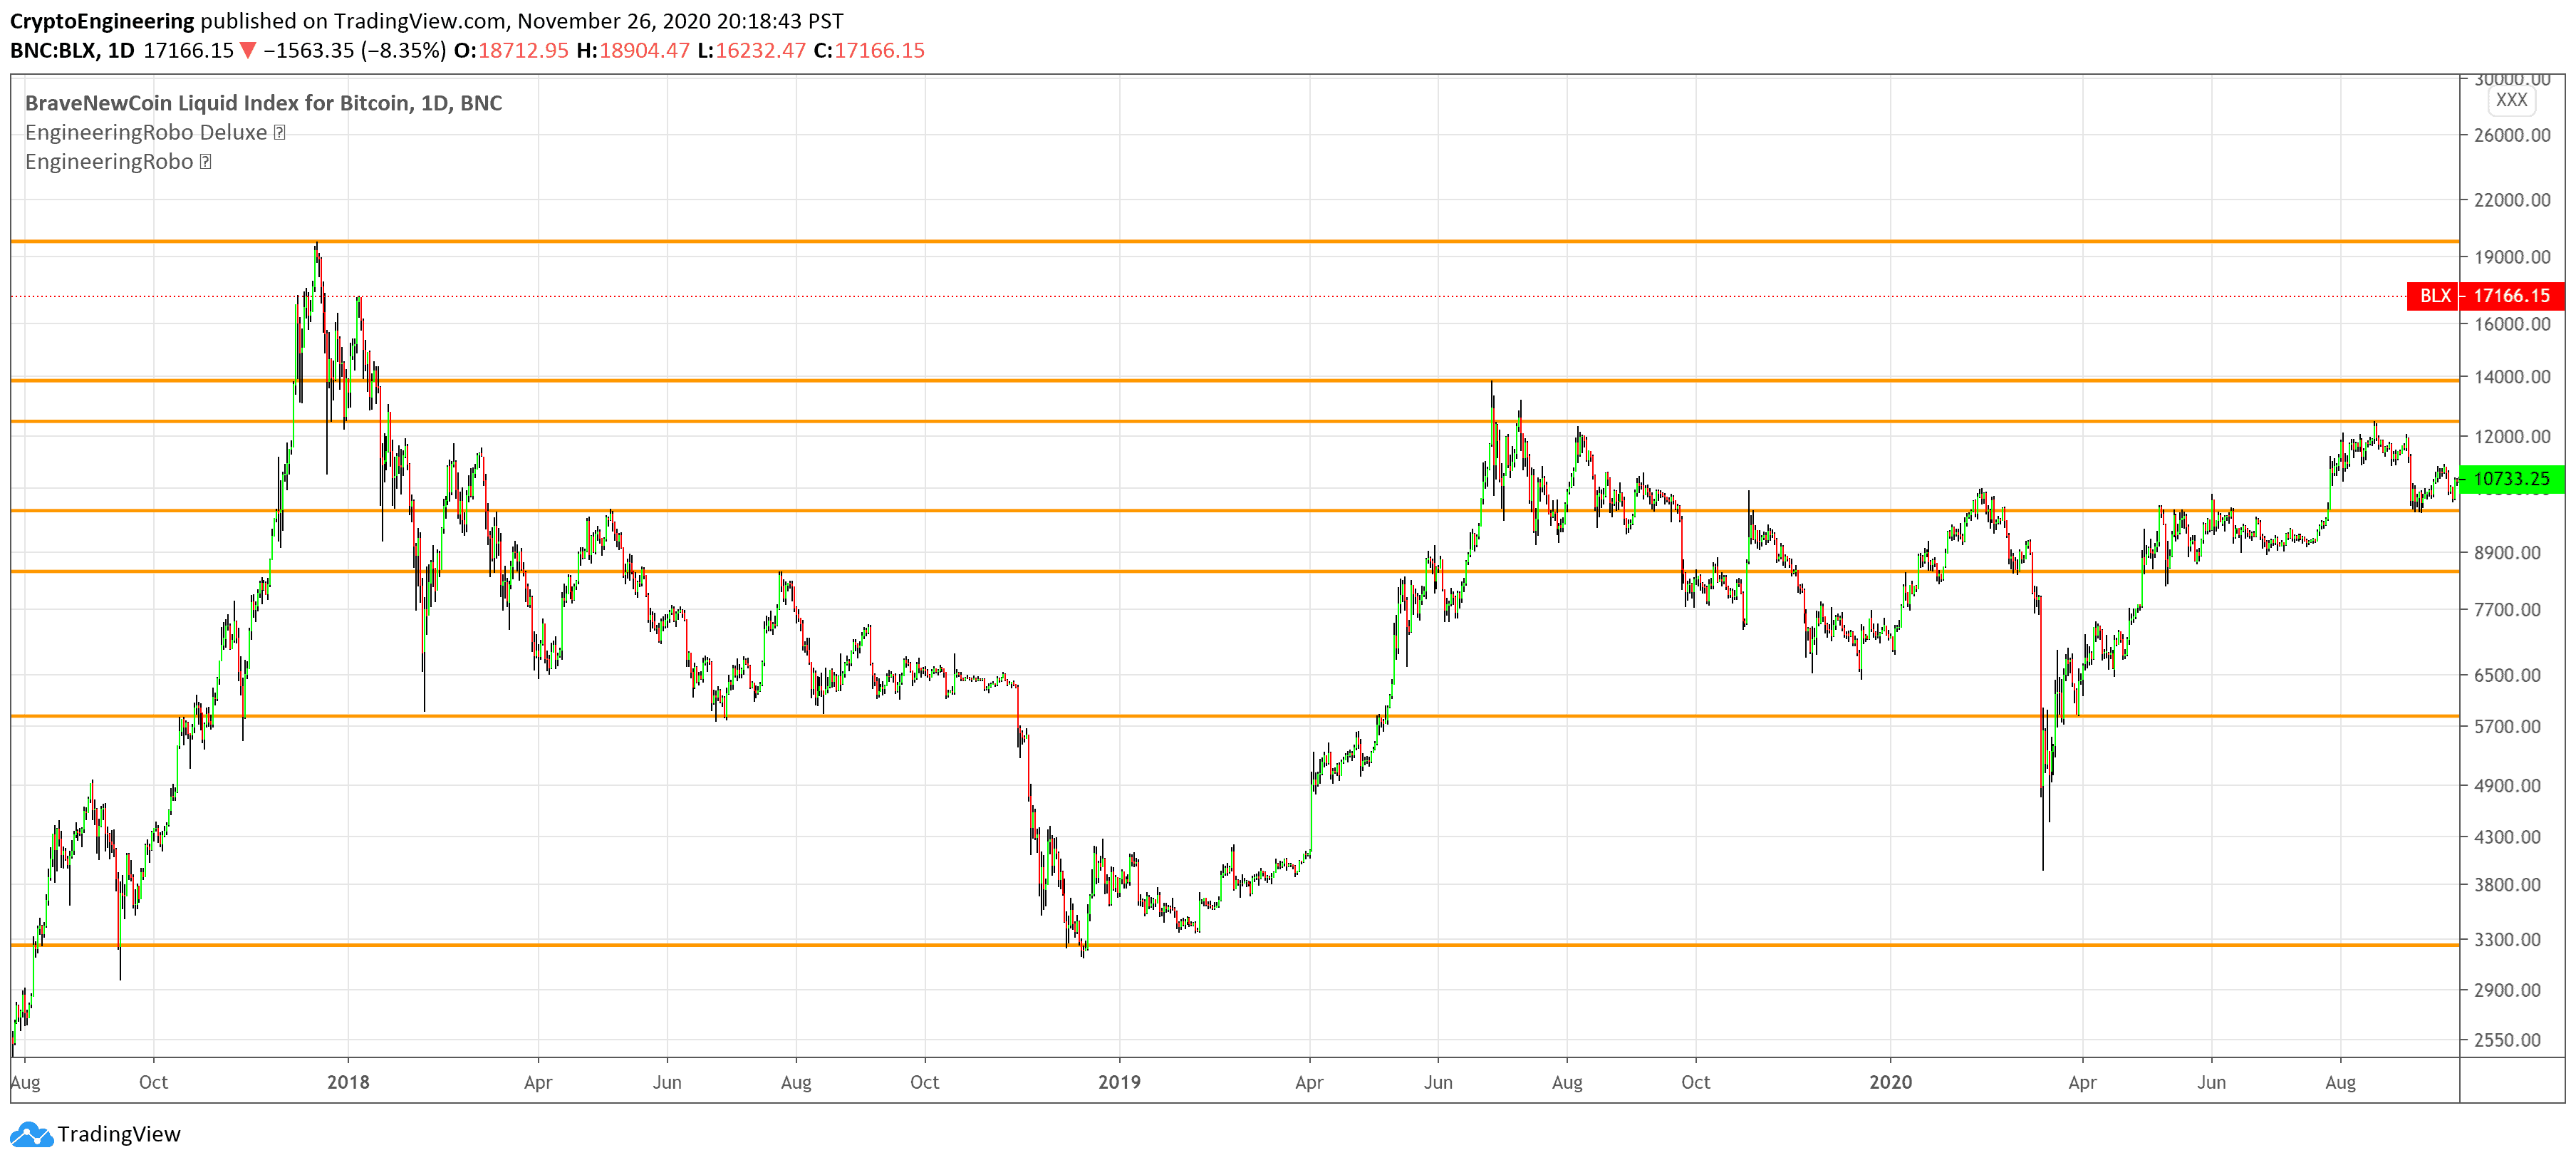
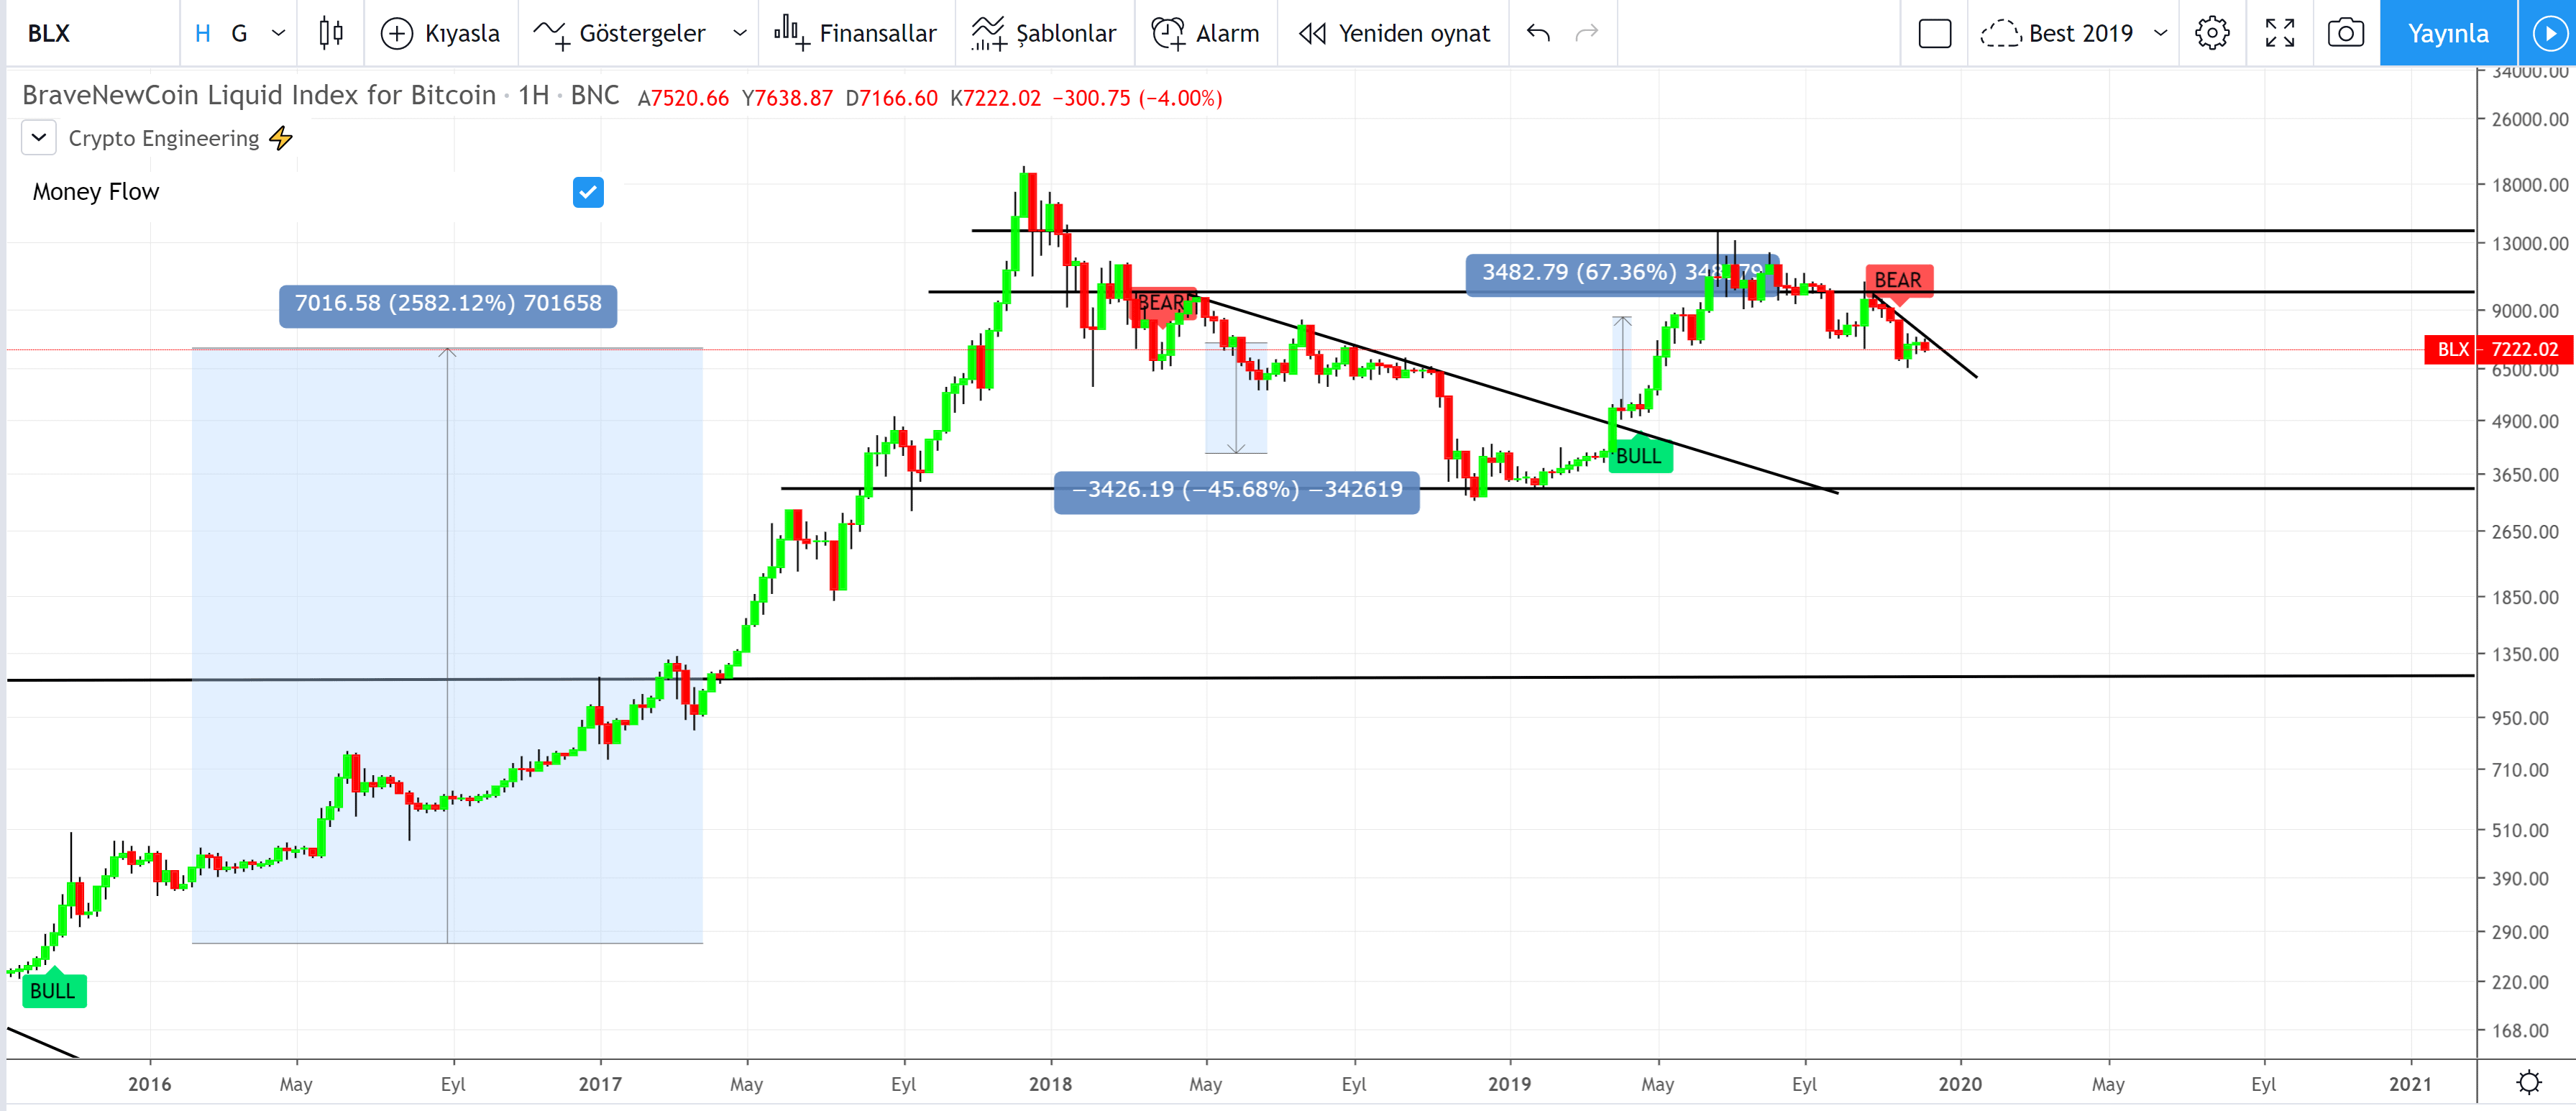
Dynamic Support and Resistance Levels
On the most fundamental level, support and resistance are simple concepts. The price finds a level that it’s unable to break through, with this level acting as a barrier of some sort. In the case of support, price finds a “floor,” while in the case of resistance, it finds a “ceiling.” Basically, you could think of support as a zone of demand and resistance as a zone of supply.
While more traditionally, support and resistance are indicated as lines, the real-world cases are usually not as precise. Bear in mind; the markets aren’t driven by some physical law that prevents them from breaching a specific level. This is why it may be more beneficial to think of support and resistance as areas. You can think of these areas as ranges on a price chart that will likely drive increased activity from traders.
Do you want to see the level of the trendlines? Click " Style " , Go to " Labels " and activate it .
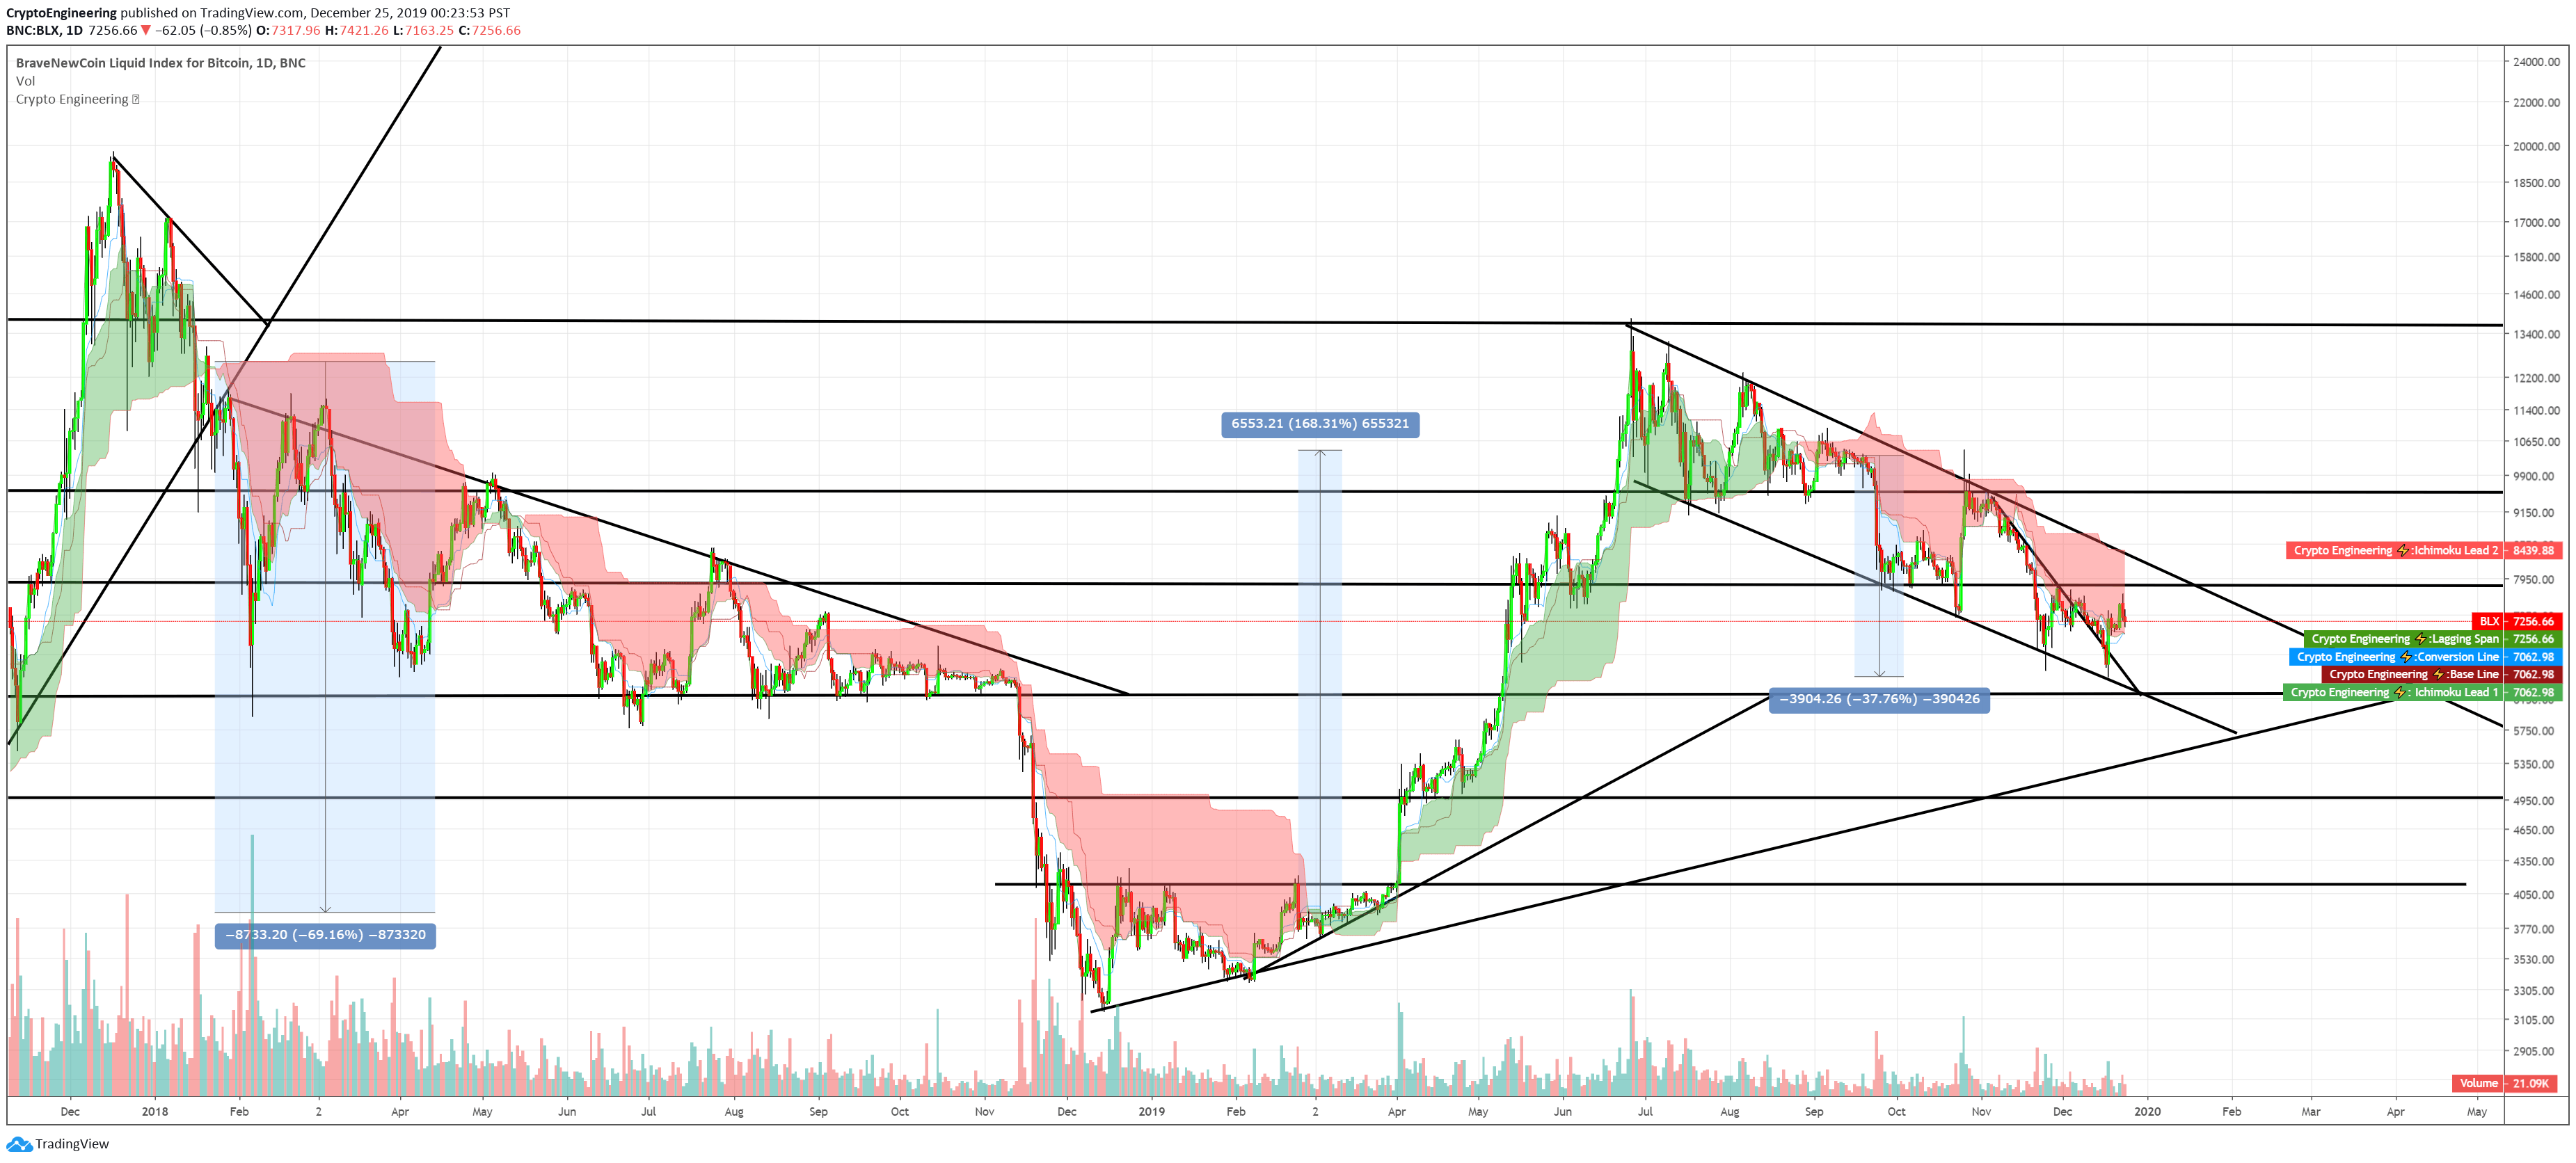
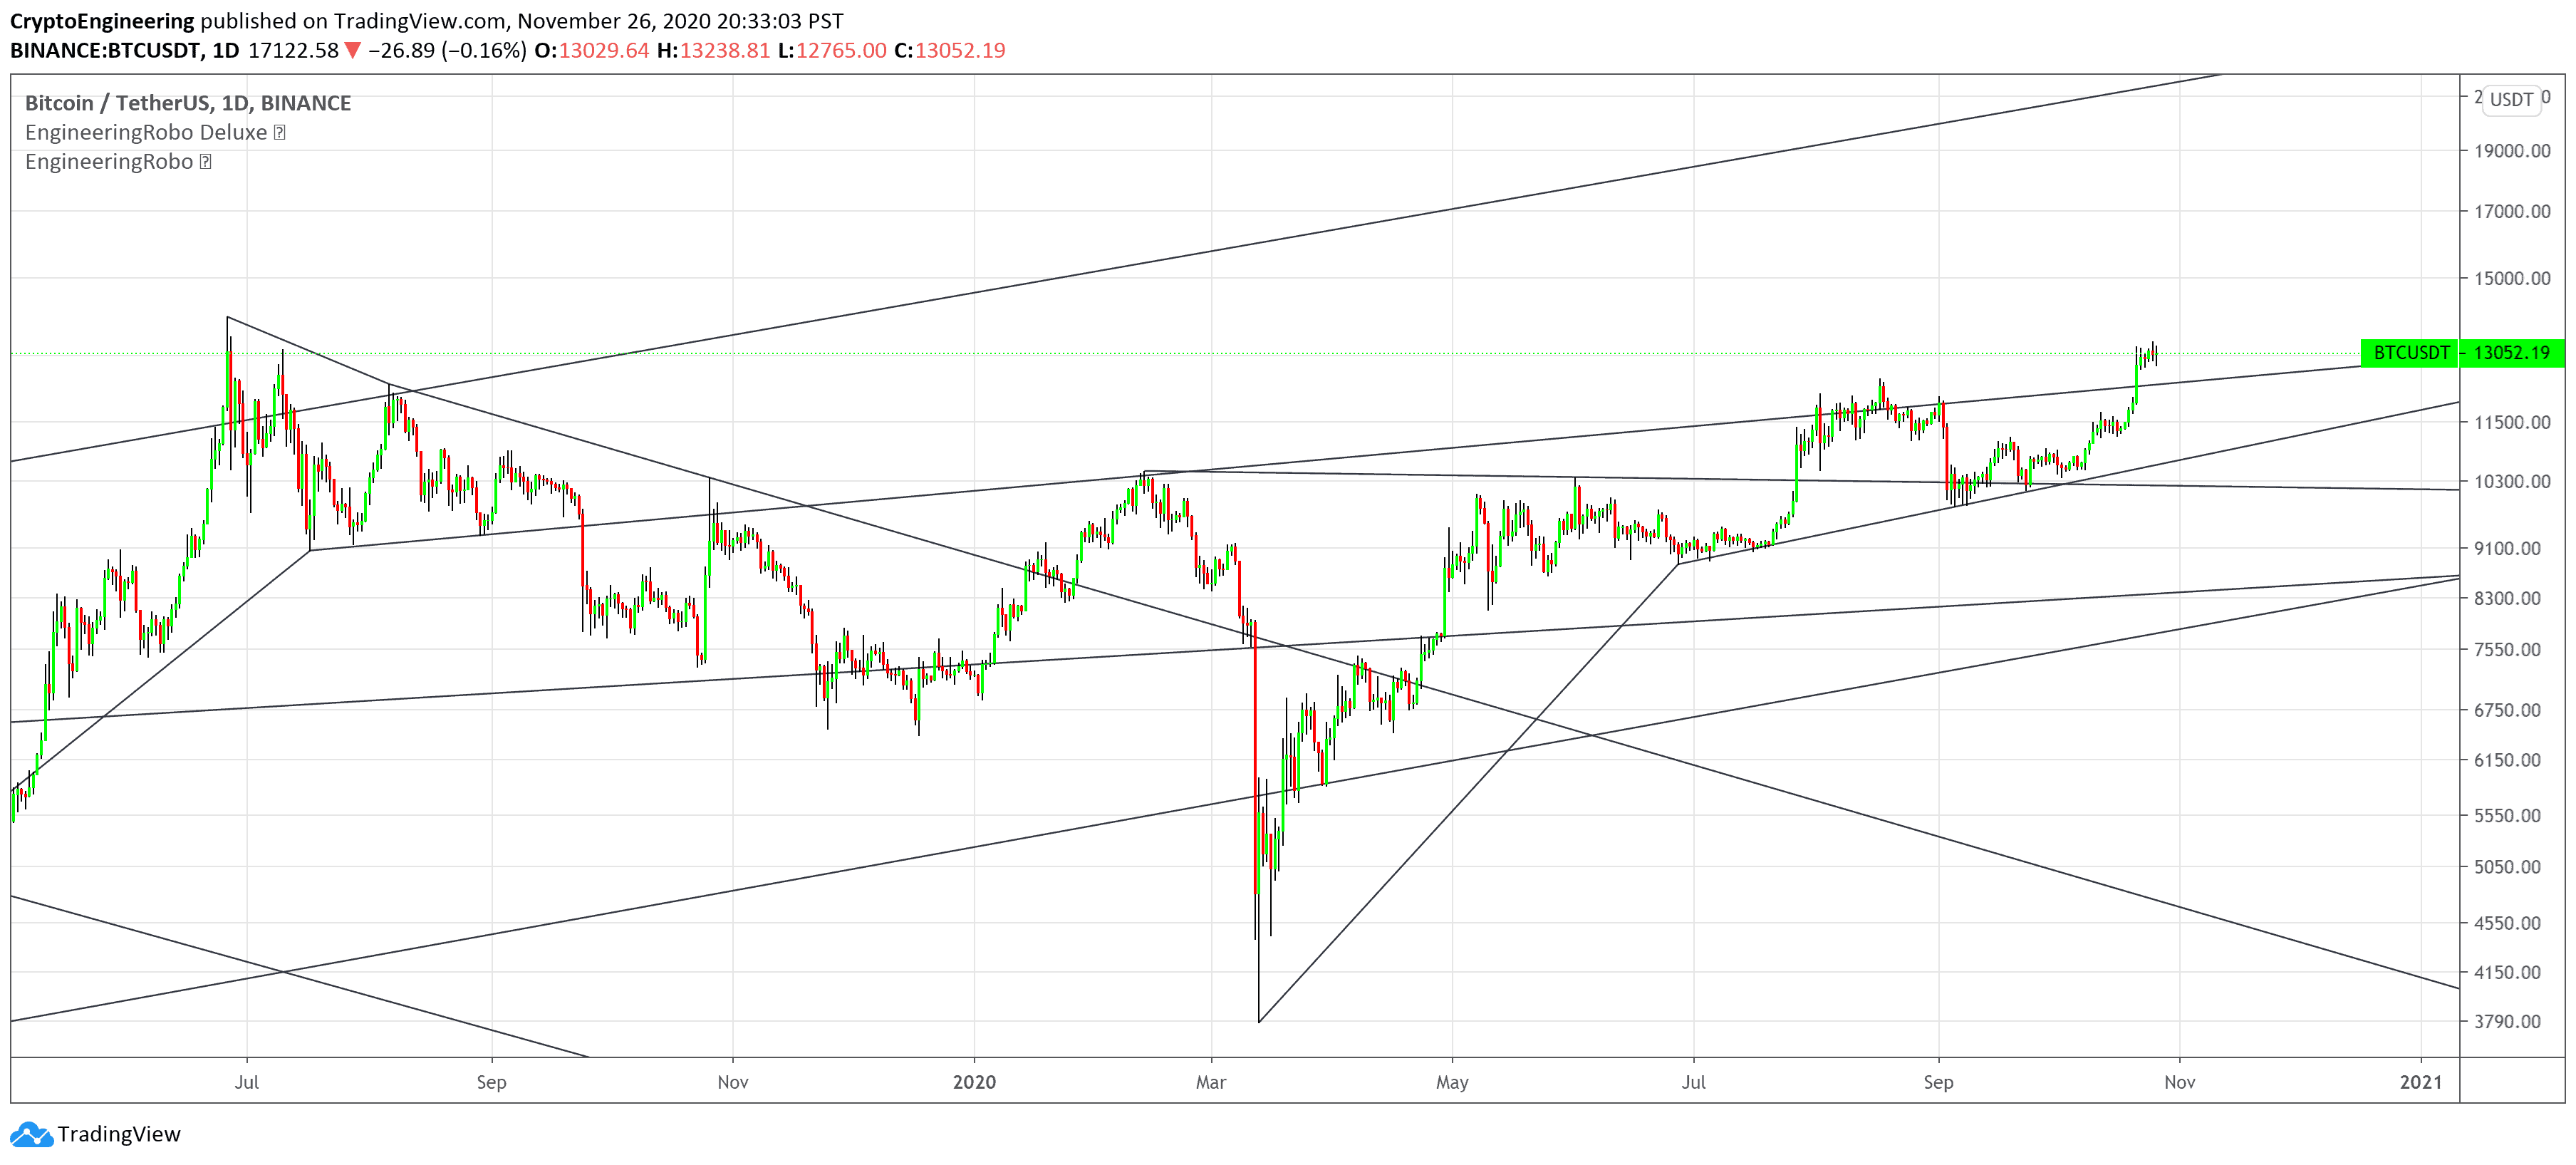
Automated Trend Channel Lines
It’s 2020 and you are still drawing lines?
The automated trend lines helps you find the best trend lines and you can stop re-drawing over and over. You don't need to flip back and forth between different timeframes. You can let your robo advisor do the work for you.
If you are following any EngineeringRobo signals, you should always wait for the candle close before buying or selling.
The signal can come and go anytime during the live candle. ALL indicators do that, that is not considered repainting.
Repainting is when a signal appears, the candle is closed, and when you refresh the chart it disappeared. It is logical that until the candle is closed the signal is not decided yet, hence the alert setup as Once per bar Close.
EngineeringRobo never repaints! Yes, you heard it right: you will never have to worry about signal changing after the candle is closed.
Added alarm system alerts for all signals.
__________________________Timeframes_______________________________________
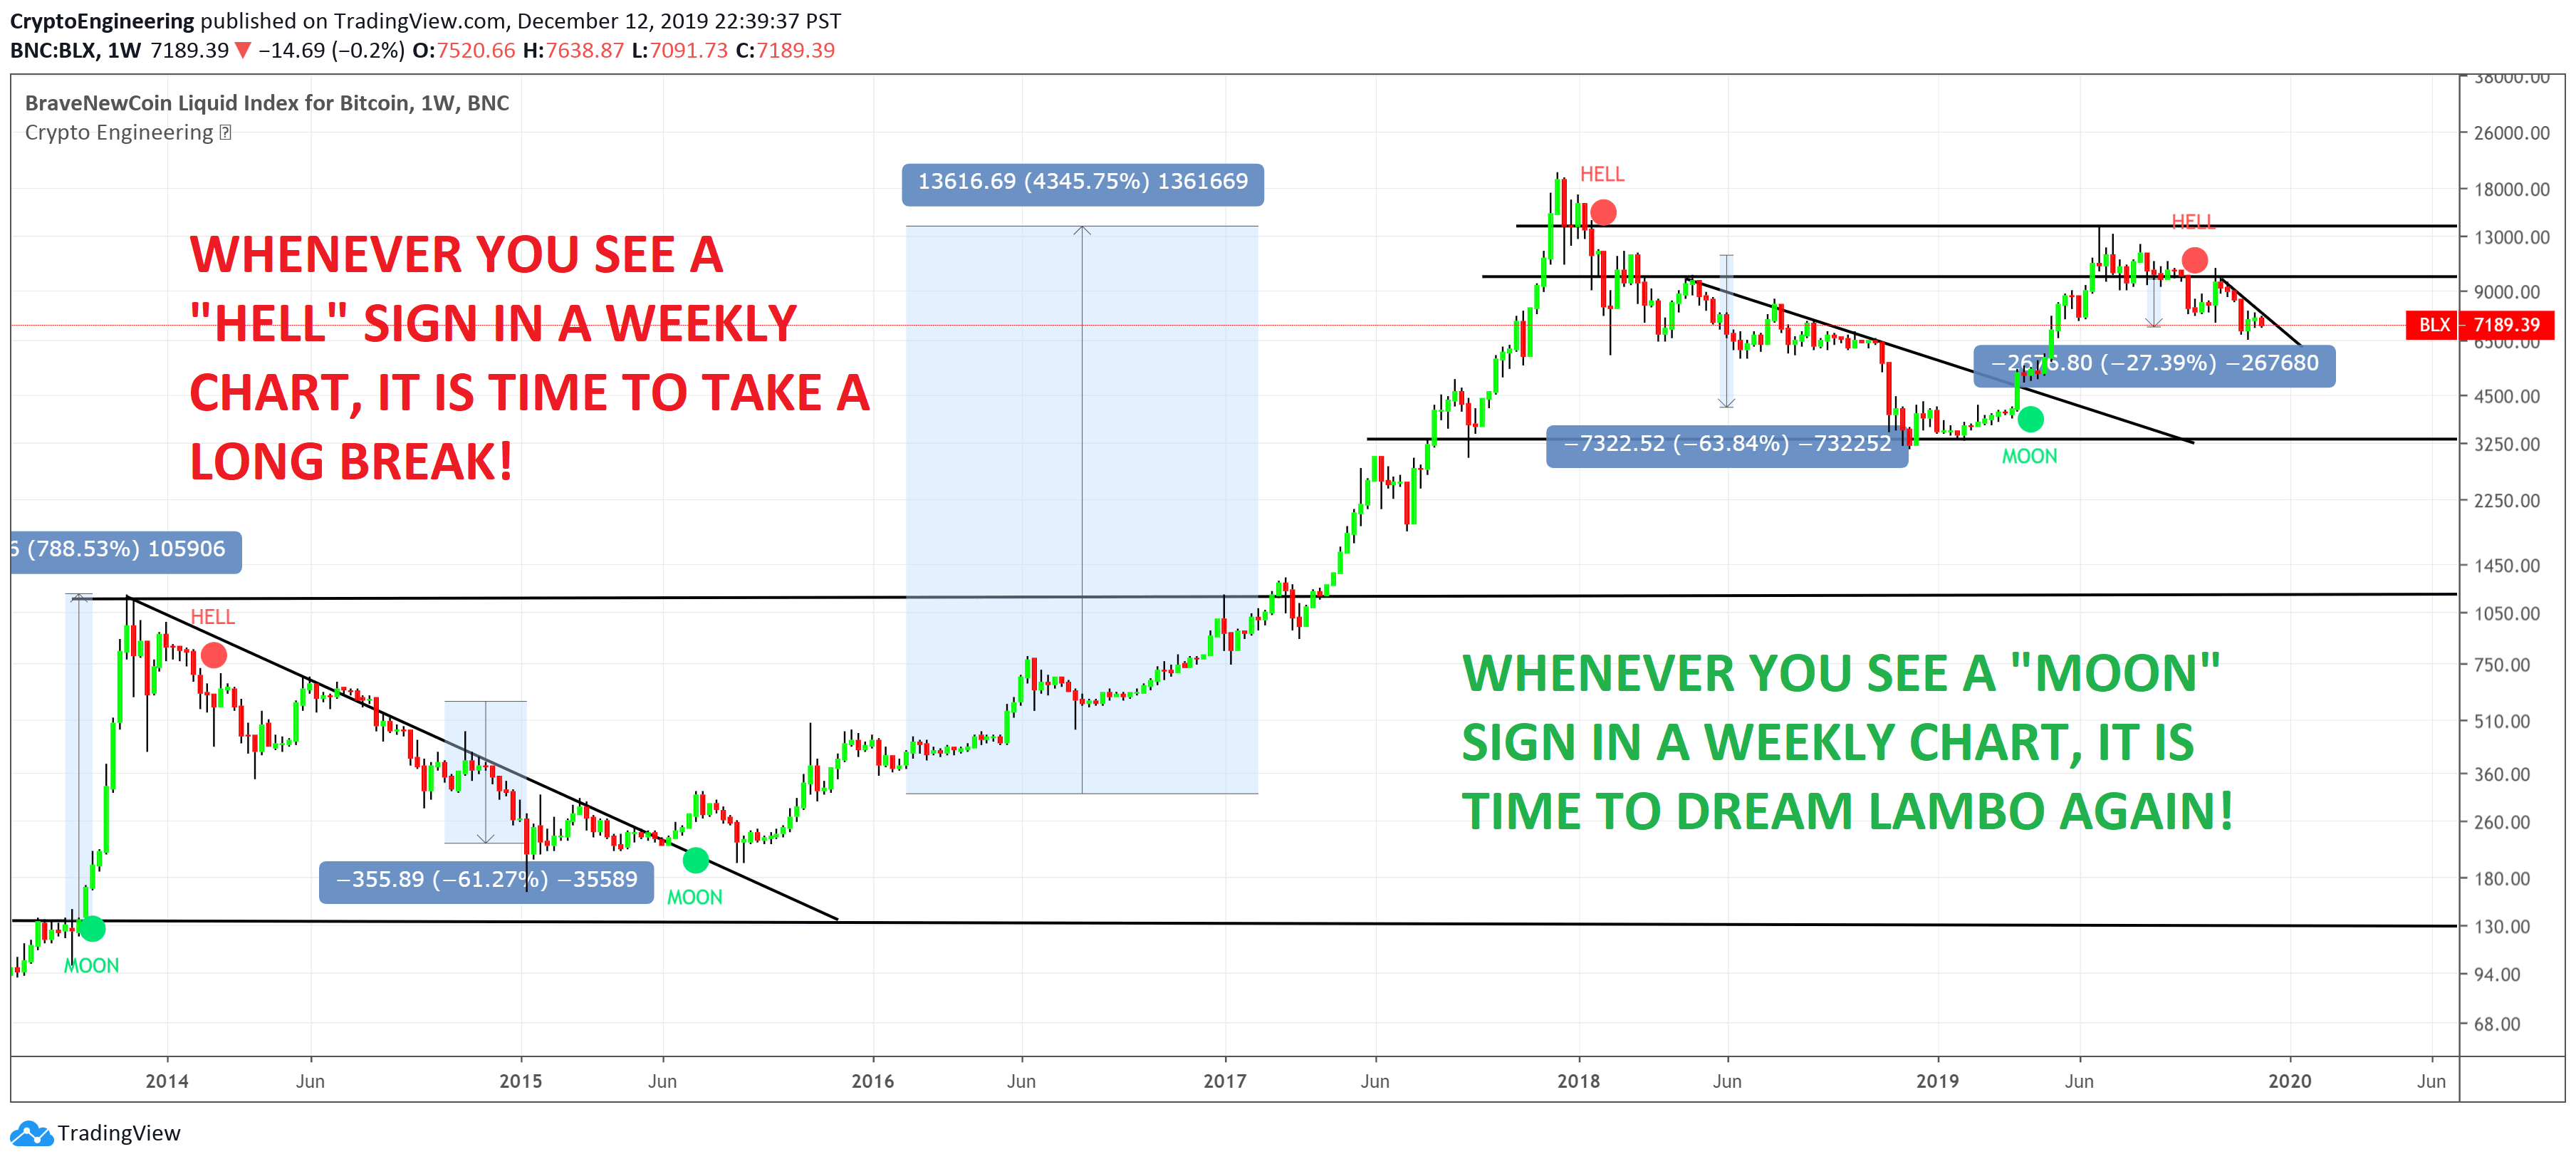
Our recommendations to get the best results:
Swing Trading Crypto : Use 1D Time Frame Candles
Swing Trading Stocks : Use 1W Time Frame Candles
Swing Trading Commodities : Use 1W Time Frame Candles
Day Trading Crypto : Use 3H Time Frame Candles
Day Trading Stocks : Use 1D Time Frame Candles
Day Trading Commodities : Use 1D Time Frame Candles
Not recommended any other time frames.
What Is Risk-Reward Ratio RRR?
Your risk-reward ratio is how much you risk per trade, relative to how much you expect to make (reward).
When trading with Robo , you should always aim for a bigger reward compared to your risk per trade.
A good rule is only to risk 1% per trade for day traders and 5% per trade for swing trader . Robo follows strong risk management rules on the algorithm .
One of the biggest advantages of algo trading is removing human emotion from the financial markets,humans trading are susceptible to emotions that lead to irrational decisions. Robo doesn't have to think or feel good to make a trade. If conditions are met, it enters.When the trade goes the wrong way or hits a profit target, It exits. It doesn't get angry at the market or feel invincible after making a few good trades.
EngineeringRobo gives you all the tools and information you need for day-to-day trading and investing, while also keeping a great buy and sell signals! No excuse to lose in any financial market anymore! Try now!
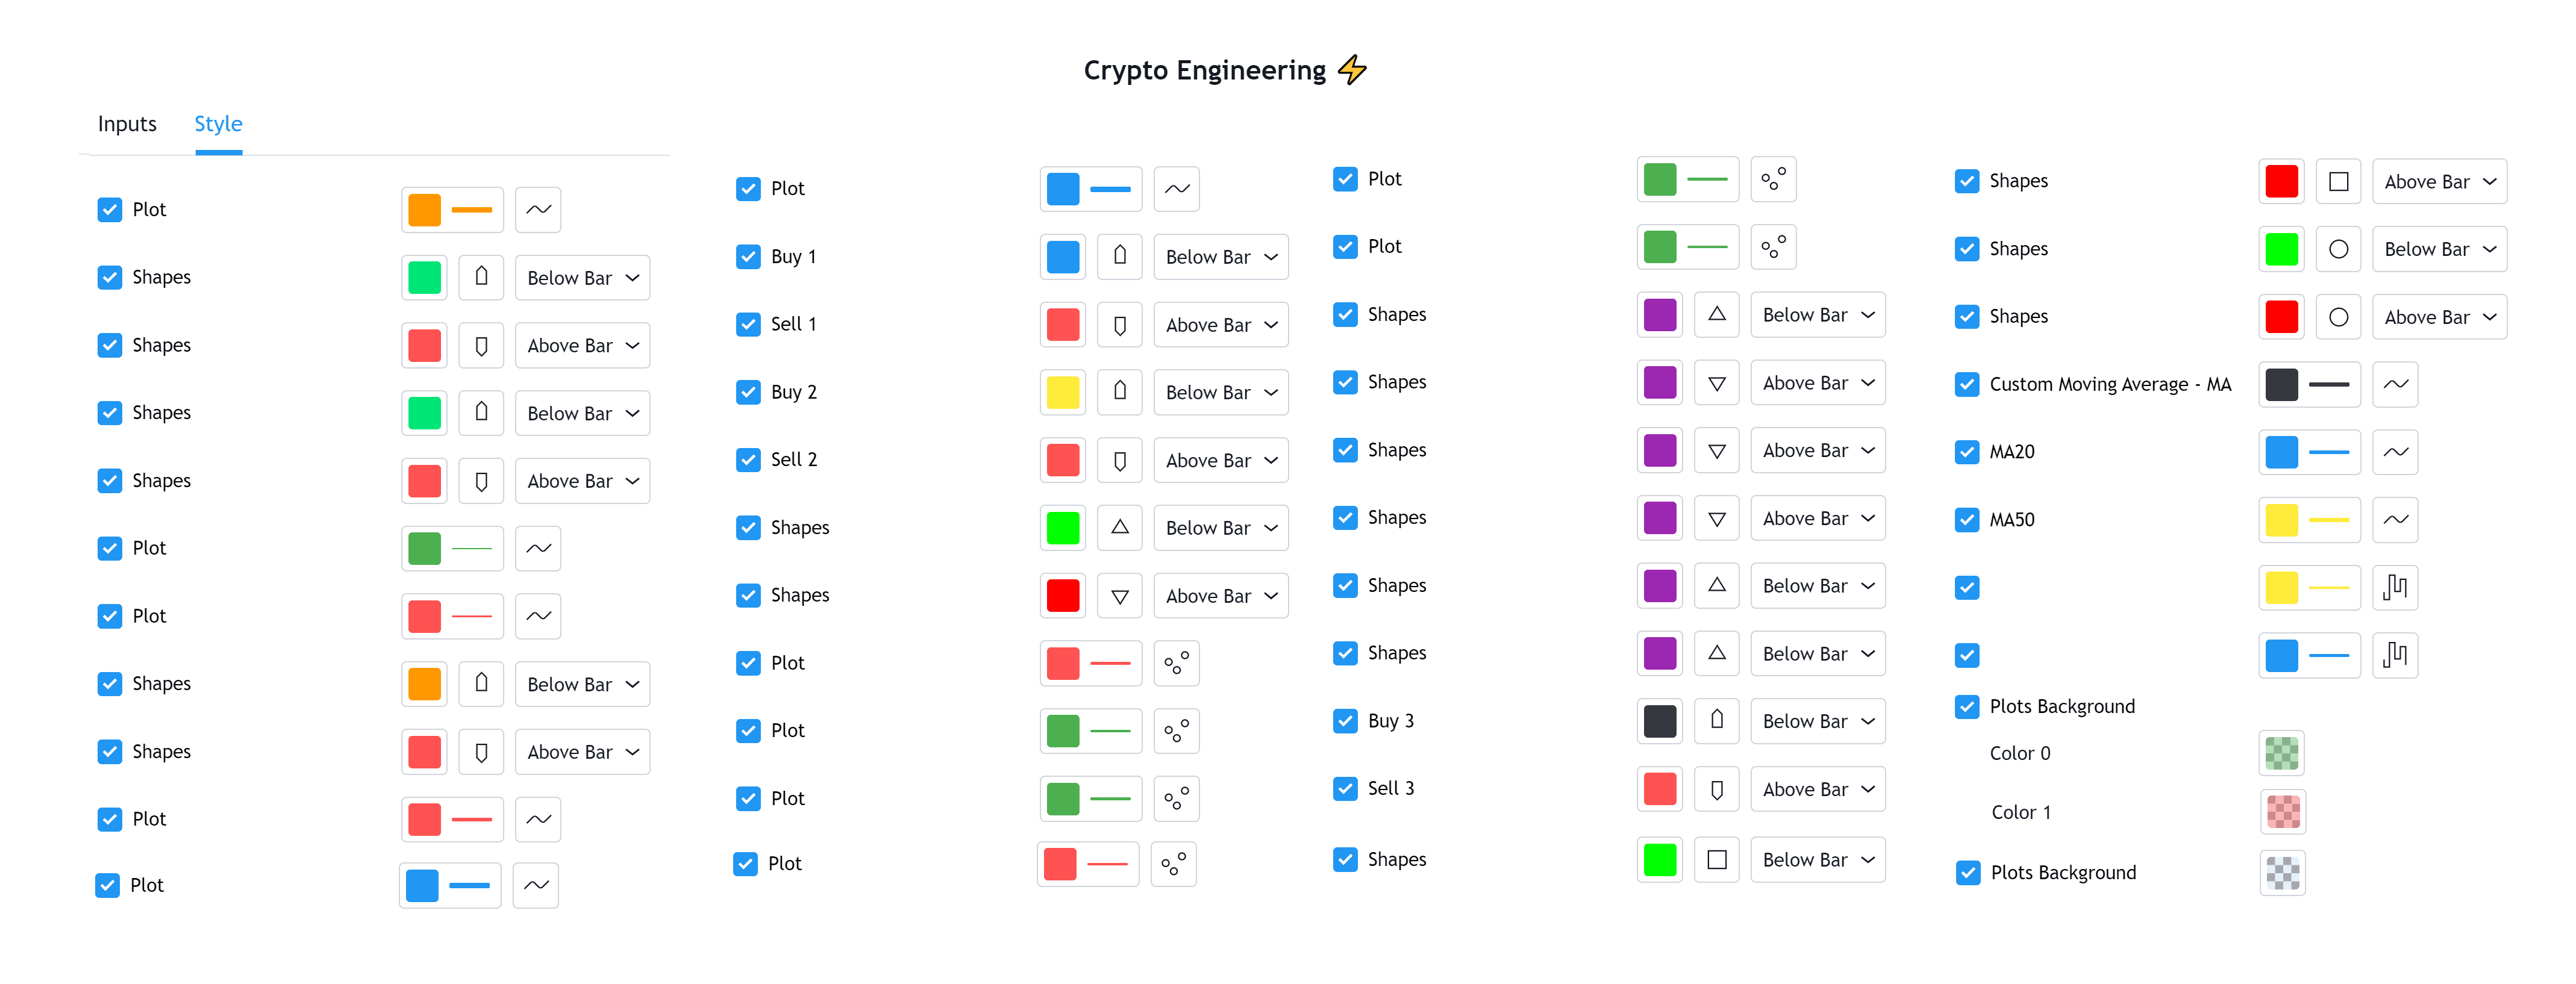
Do you also know that you can change the color of indicators on EngineeringRobo? Try it.