EngineeringRobo’s secret formula

Frequently Asked Questions
July 24, 2018
Got the VIP membership for EngineeringRobo. What is next?
July 24, 2018EngineeringRobo's Secret Formula
EngineeringRobo's unique algorithm finds profitable cryptocurrencies, stocks and commodities based on their Ichimoku, VPVR, ATR, Fibonacci Levels, McGinley Dynamic, Moving Averages, RSI, MACD, Stochastic, Bollinger Bands, Volumes and Price Changes to give you entry and exit ideas.
McGinley Dynamic
It looks like a moving average line, yet it is actually a smoothing mechanism for prices that turn out to track far better than any moving average. It minimizes price separation, price whipsaws, and hugs prices much more closely. And it does this automatically as a factor of its formula. No need to hurry to sell as long as the coin /stock/ commodity is above the McGinley Dynamic Line on 1D candlestick charts.
Fibonacci Retracements & Extensions
Fibonacci levels are one of the most popular tools in technical trading.
Fibonacci retracements are often used to identify the end of a correction or a counter-trend bounce. Corrections and counter-trend bounces often retrace a portion of the prior move. While short 23.6% retracements do occur, the 38.2-61.8% zone covers most possibilities (with 50% in the middle). This zone may seem big, but it is just a reversal alert zone. One of the best ways to use the Fibonacci retracement tool is to spot potential support and resistance levels and see if they line up with Fibonacci retracement levels. Fibonacci tools return the best results when combined with other technical tools, such as trendlines, chart patterns, candlestick patterns, channels or technical indicators.
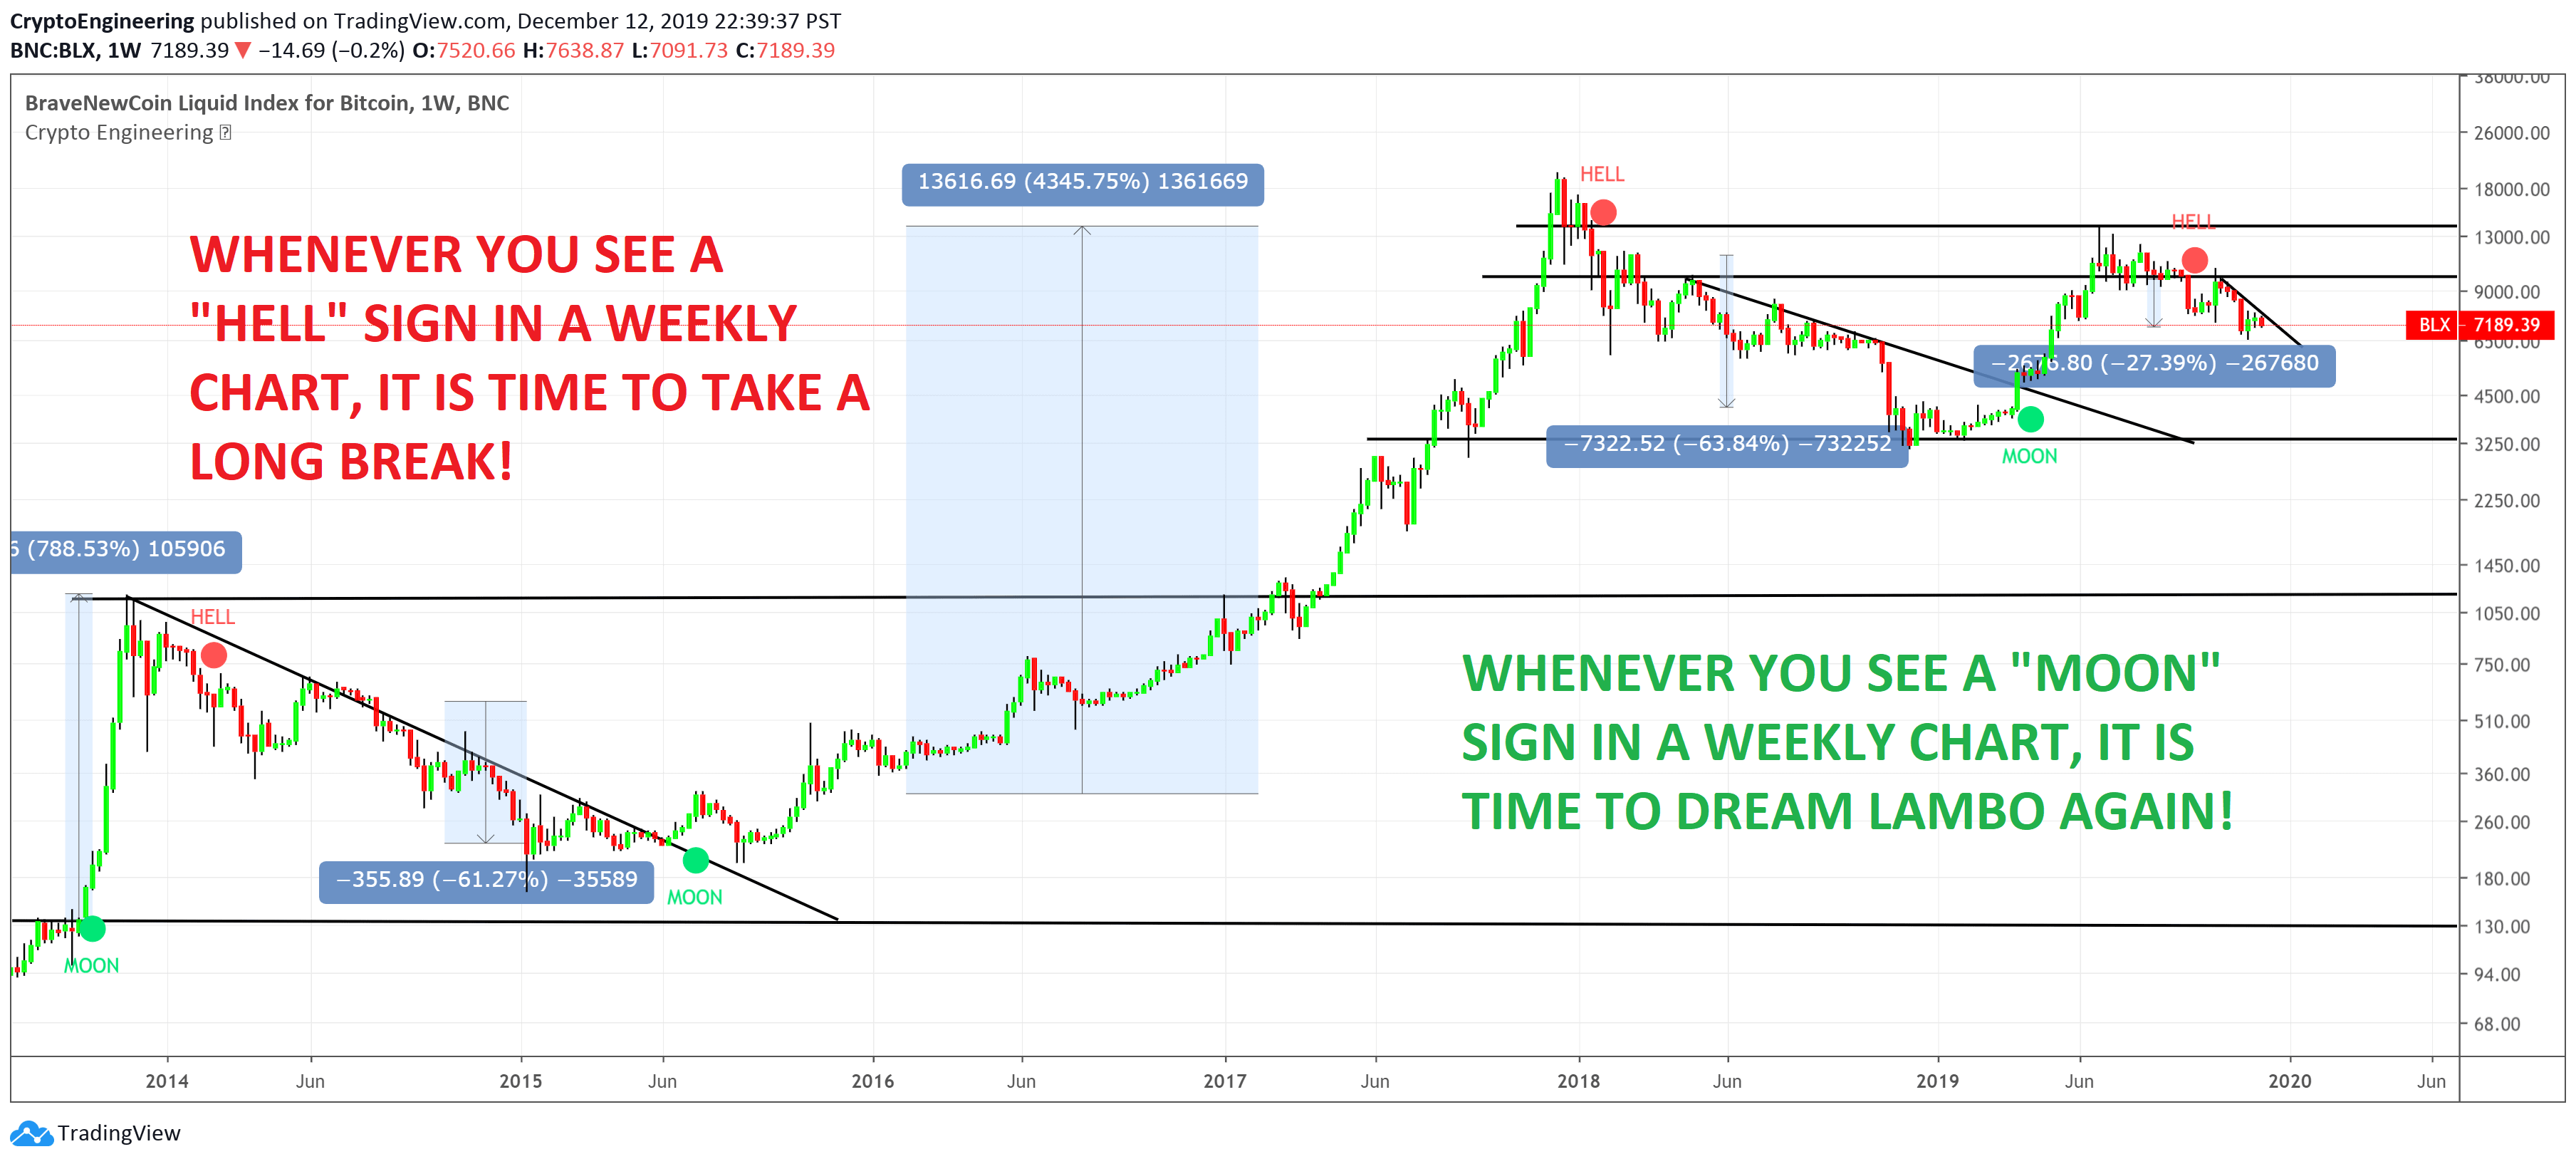
MOON OR HELL
“Moon or HELL “is a very simple indicator.
The Buy and Sell signal changes as soon as the indicator flips over the closing price. When the “Moon or Hell “closes below the price, a buy signal is generated. On the contrary, Moon or Hell” closes above the price, a sell signal is generated. On the chart this is shown with green and red circles so that all you have to do is use the green circle for buy and red circle for sell.
Recommend you to use on 1W candlesticks.
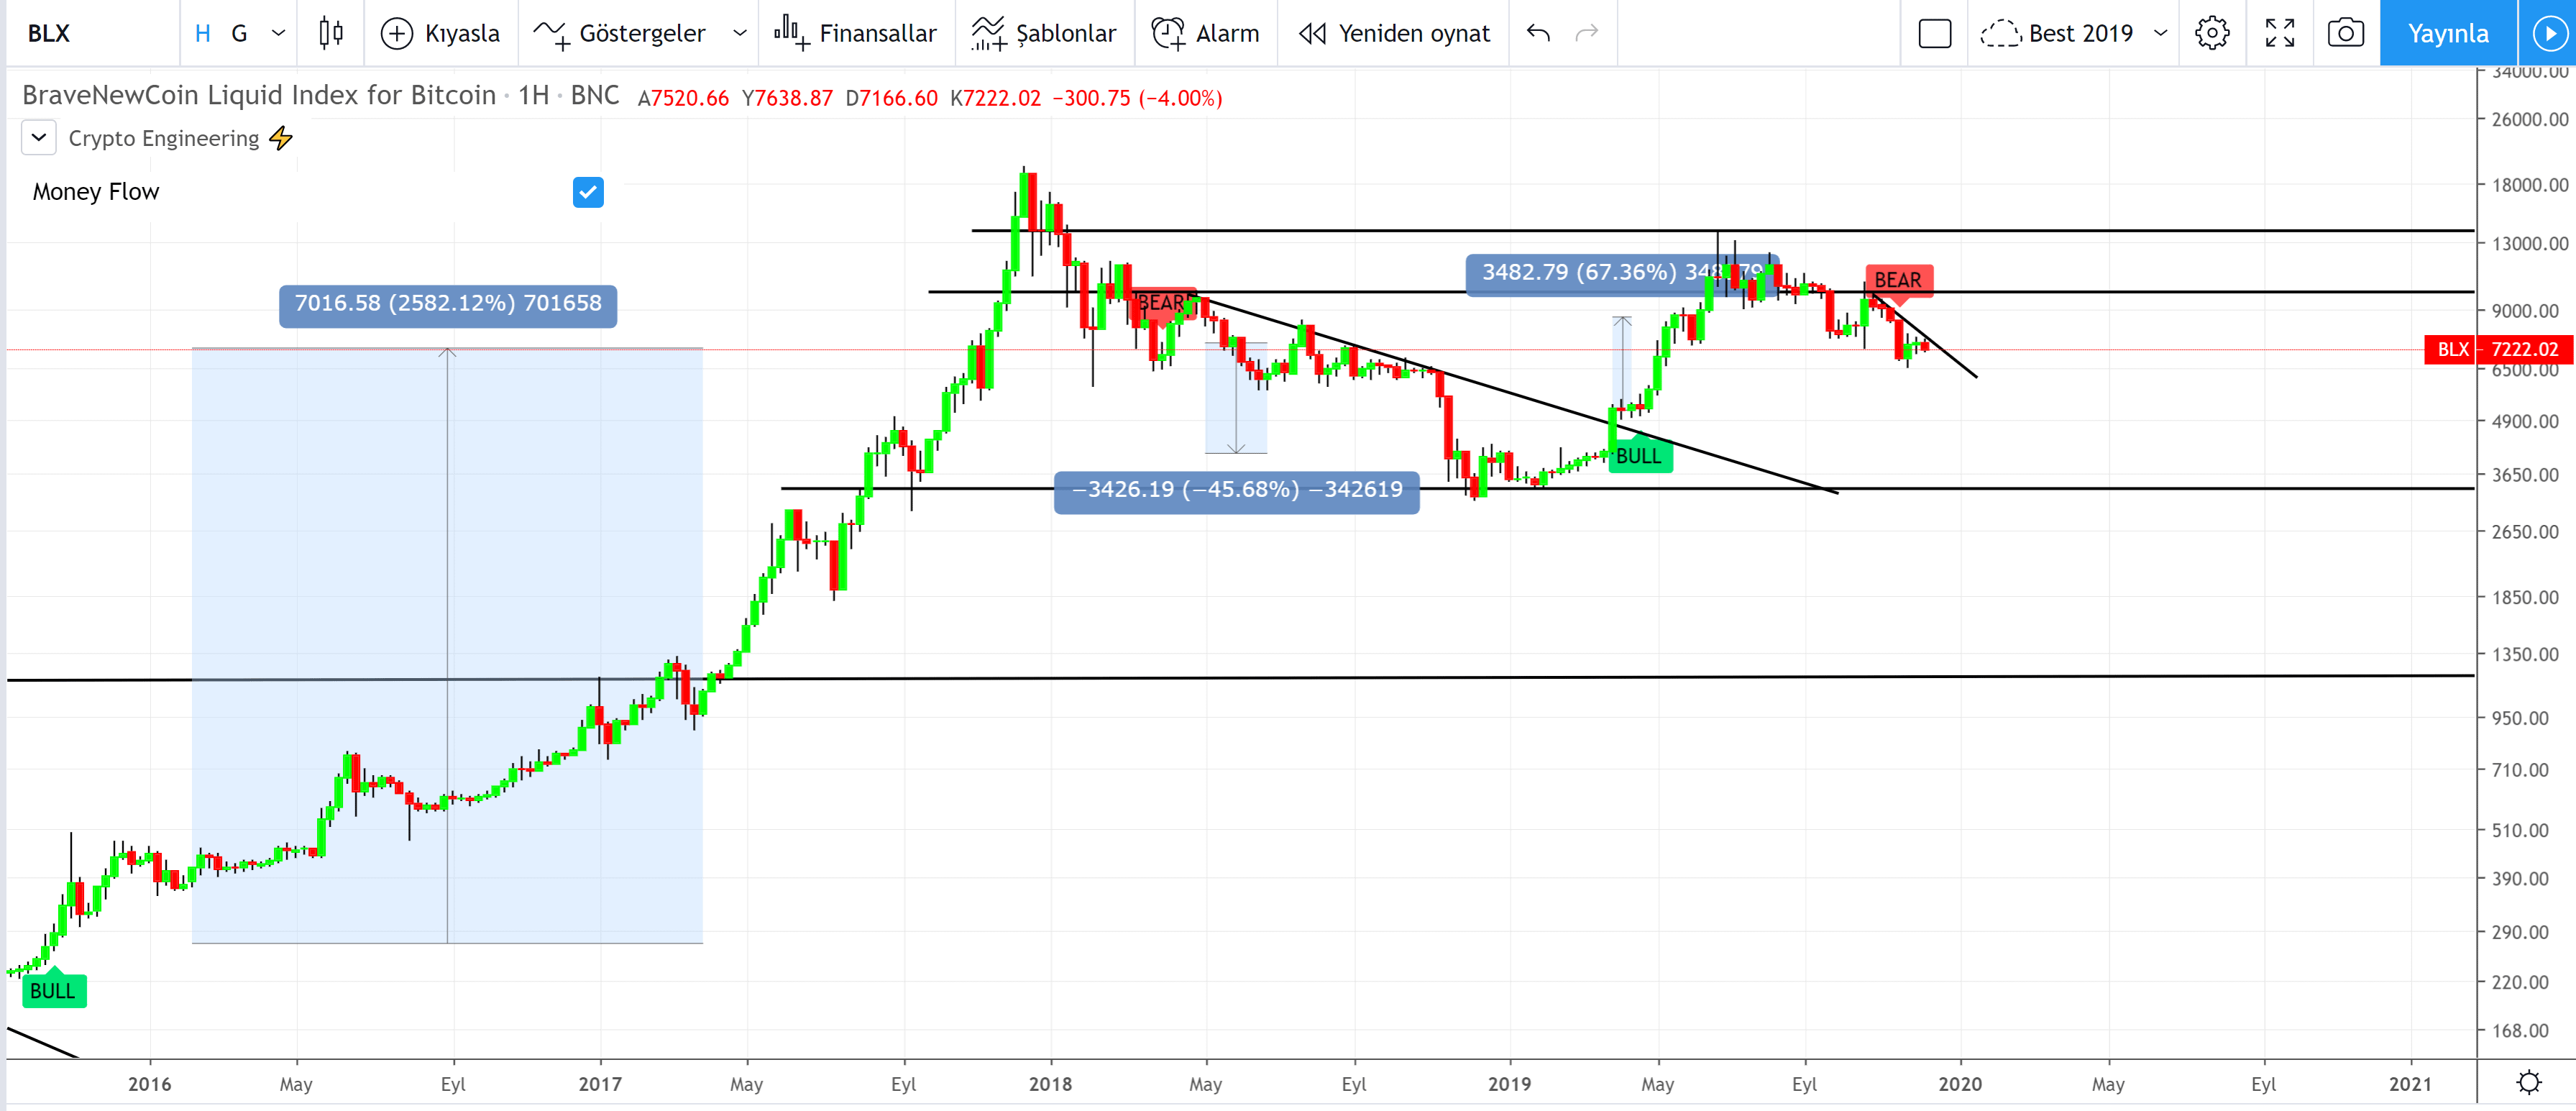
MONEY FLOW
The Money Flow can be a fairly valuable tool. Momentum is one of those aspects of the market that is crucial to understanding price movements.
When Money Flow gives you " Bull " signal , short term momentum is now rising faster than the long term momentum. This can present a bullish buying opportunity. When Money Flow gives you "Bear " signal, short term momentum is now falling faster than the long-term momentum. This can present a bearish selling opportunity.
Recommend you to use on 1W candlesticks.
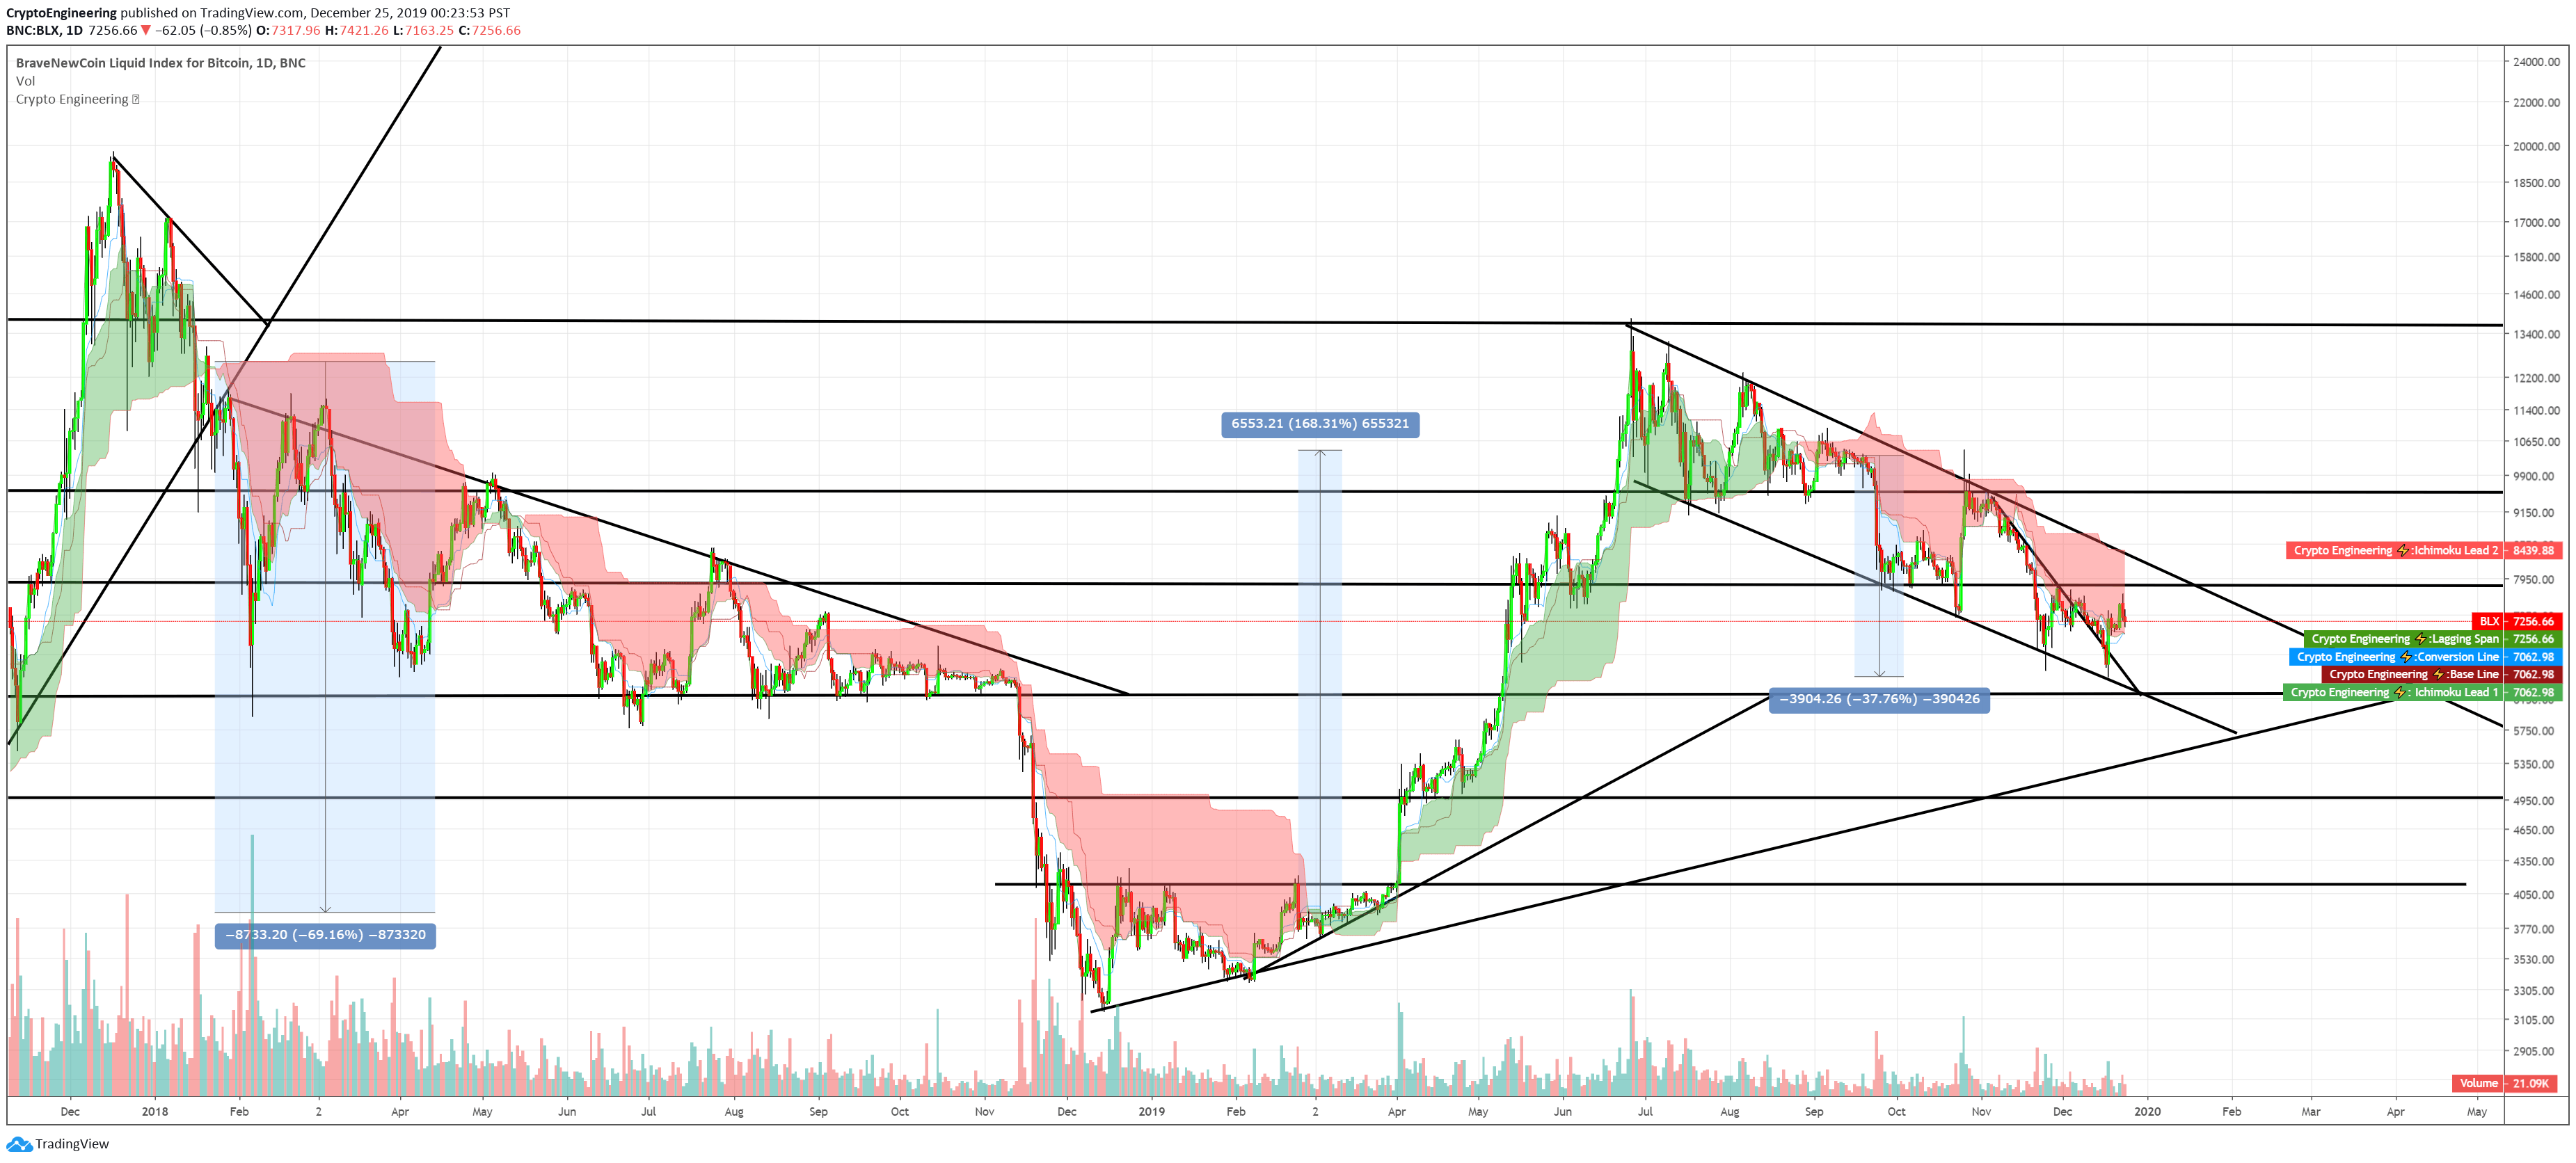
EngineeringRobo's Cloud
The indicator inspired from Ichimoku cloud, uses a unique formula to generate clouds on its own system! " BUY or ENTER "when the price breaks the cloud in the direction of the breakout ( up ) and the cloud turns to green colour. Stay in the market until the cloud turns to red colour. Let's assume that you are a swing trader and use 1D candles as long as the candle is above the "green" cloud, you should continue with a trend! No need to hurry to sell until you see the "red" cloud.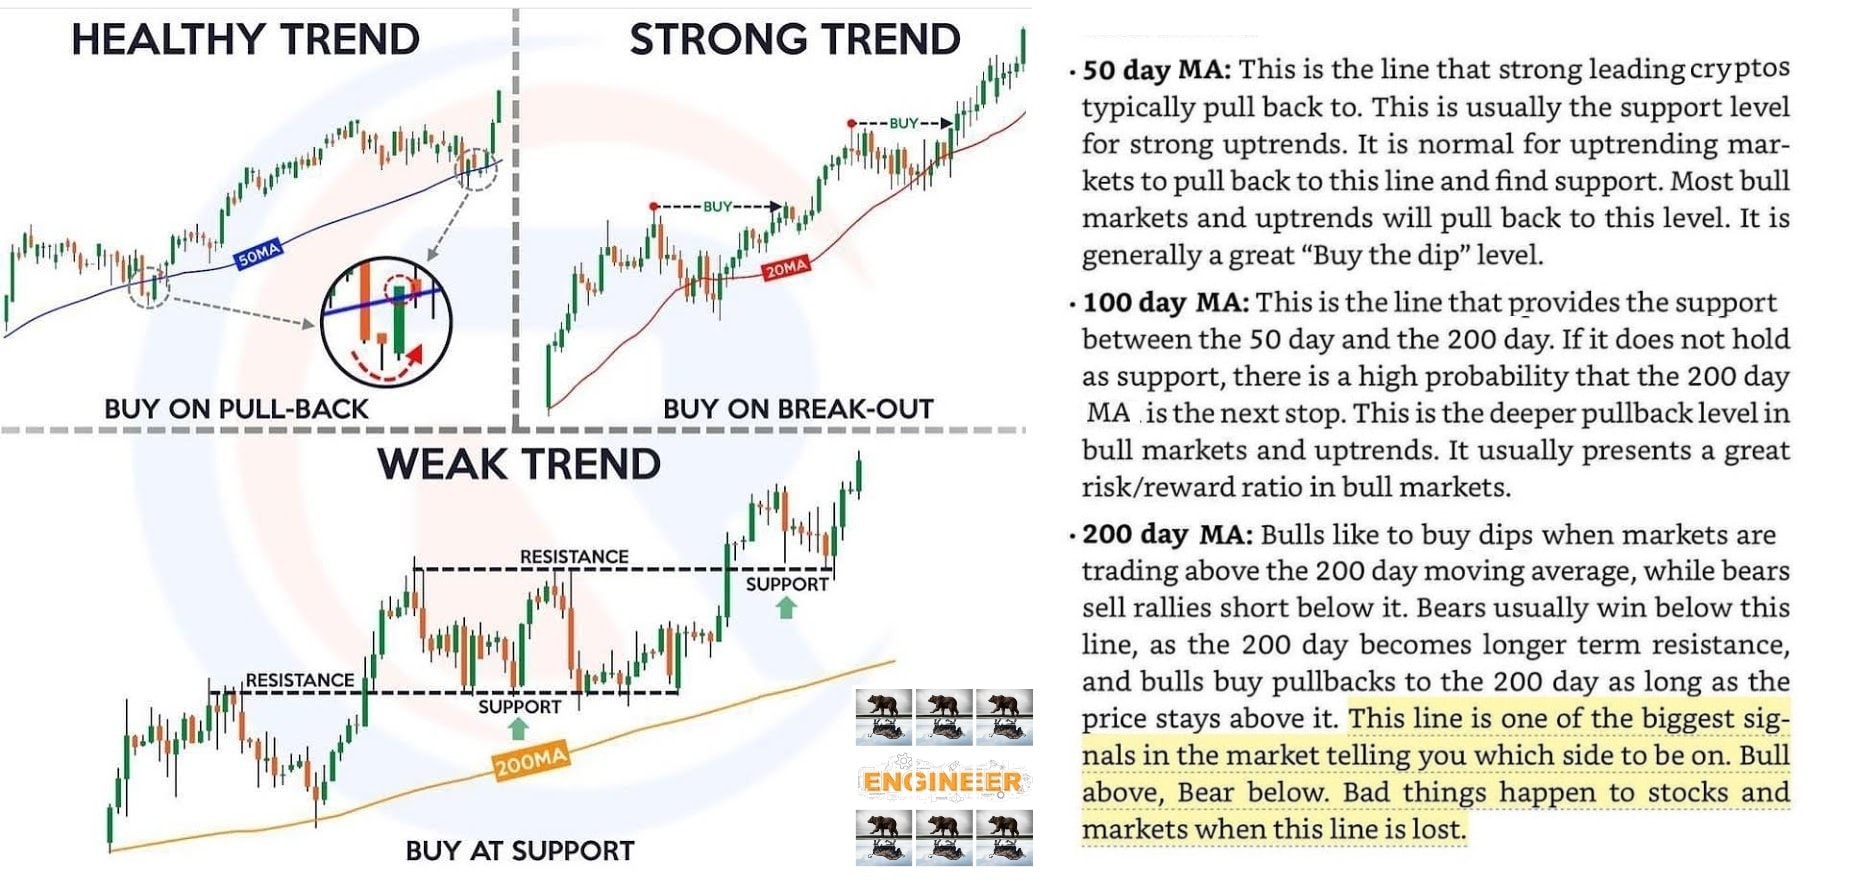
Moving Averages ( 20 - 50 - 100 - 200 )
Bullish: Weekly Candles open –close above MA 20 Bearish: Weekly Candles open –close below MA 50 Super Bullish : The daily candle is above MA 20 Bullish : MA 50 Above MA 100 ( Daily ) Bearish : MA 50 below MA 100 ( Daily ) If it breaks the daily trend line with a strong candle, it is the easiest buy / sell signal.🔵What is a Support & Resistance indicator?
Support and Resistance is one of the most used techniques in technical analysis. It can be identified by pivot points. The pivot points identify supply and demand zones at specific instances and timeframes, depending on the trend, and hence known as support and resistance indicator. If the price falls below a support level, that level will become resistance. If the price rises above a resistance level, it will often become support.
🔴What is a VPVR indicator?
The VPVR indicator shows volume by price. In other words, VPVR shows how many transactions or trades occur at a specific price point. It is an extremely powerful tool that traders can use to help take their strategies to the next level.🔵What does ATR stand for?
The average true range (ATR) is a technical analysis indicator that measures market volatility by decomposing the entire range of an asset price for that period. It is a volatility indicator that shows how much an asset moves, on average, during a given time frame. The indicator can help day traders confirm when they might want to initiate a trade, and it can be used to determine the placement of a stop loss order.🔴What Is a MACD indicator?
Moving Average Convergence Divergence (MACD) is a trend-following momentum indicator that shows the relationship between two moving averages of a security’s price. The MACD is an extremely popular indicator used in technical analysis. MACD helps investors understand whether the bullish or bearish movement in the price is strengthening or weakening.🔵What is a Stochastic oscillator?
A stochastic oscillator is a momentum indicator comparing a particular closing price of a security to a range of its prices over a certain period of time. The sensitivity of the oscillator to market movements is reducible by adjusting that time period or by taking a moving average of the result.🔴What is a Bollinger Band?
When stock prices continually touch the upper Bollinger Band, the prices are thought to be overbought; conversely, when they continually touch the lower band, prices are thought to be oversold, triggering a buy signal.🔵What does Golden Cross stand for?
The golden cross is a technical chart pattern indicating the potential for a major rally. The golden cross appears on a chart when a stock's short-term moving average crosses above its long-term moving average. The golden cross can be contrasted with a death cross indicating a bearish price movement. MA 50 & MA 200 - 1D chart Moving Average 200 > Moving Average 50 : Sell Moving Average 50 > Moving Average 200 : Buy