


EngineeringRobo Deluxe and Premium are previous version of EngineeringRobo AI!
EngineeringRobo Premium user guide
1. Login to TradingView.com
2. From the homepage, click on ‘Chart’ in the top navigation bar
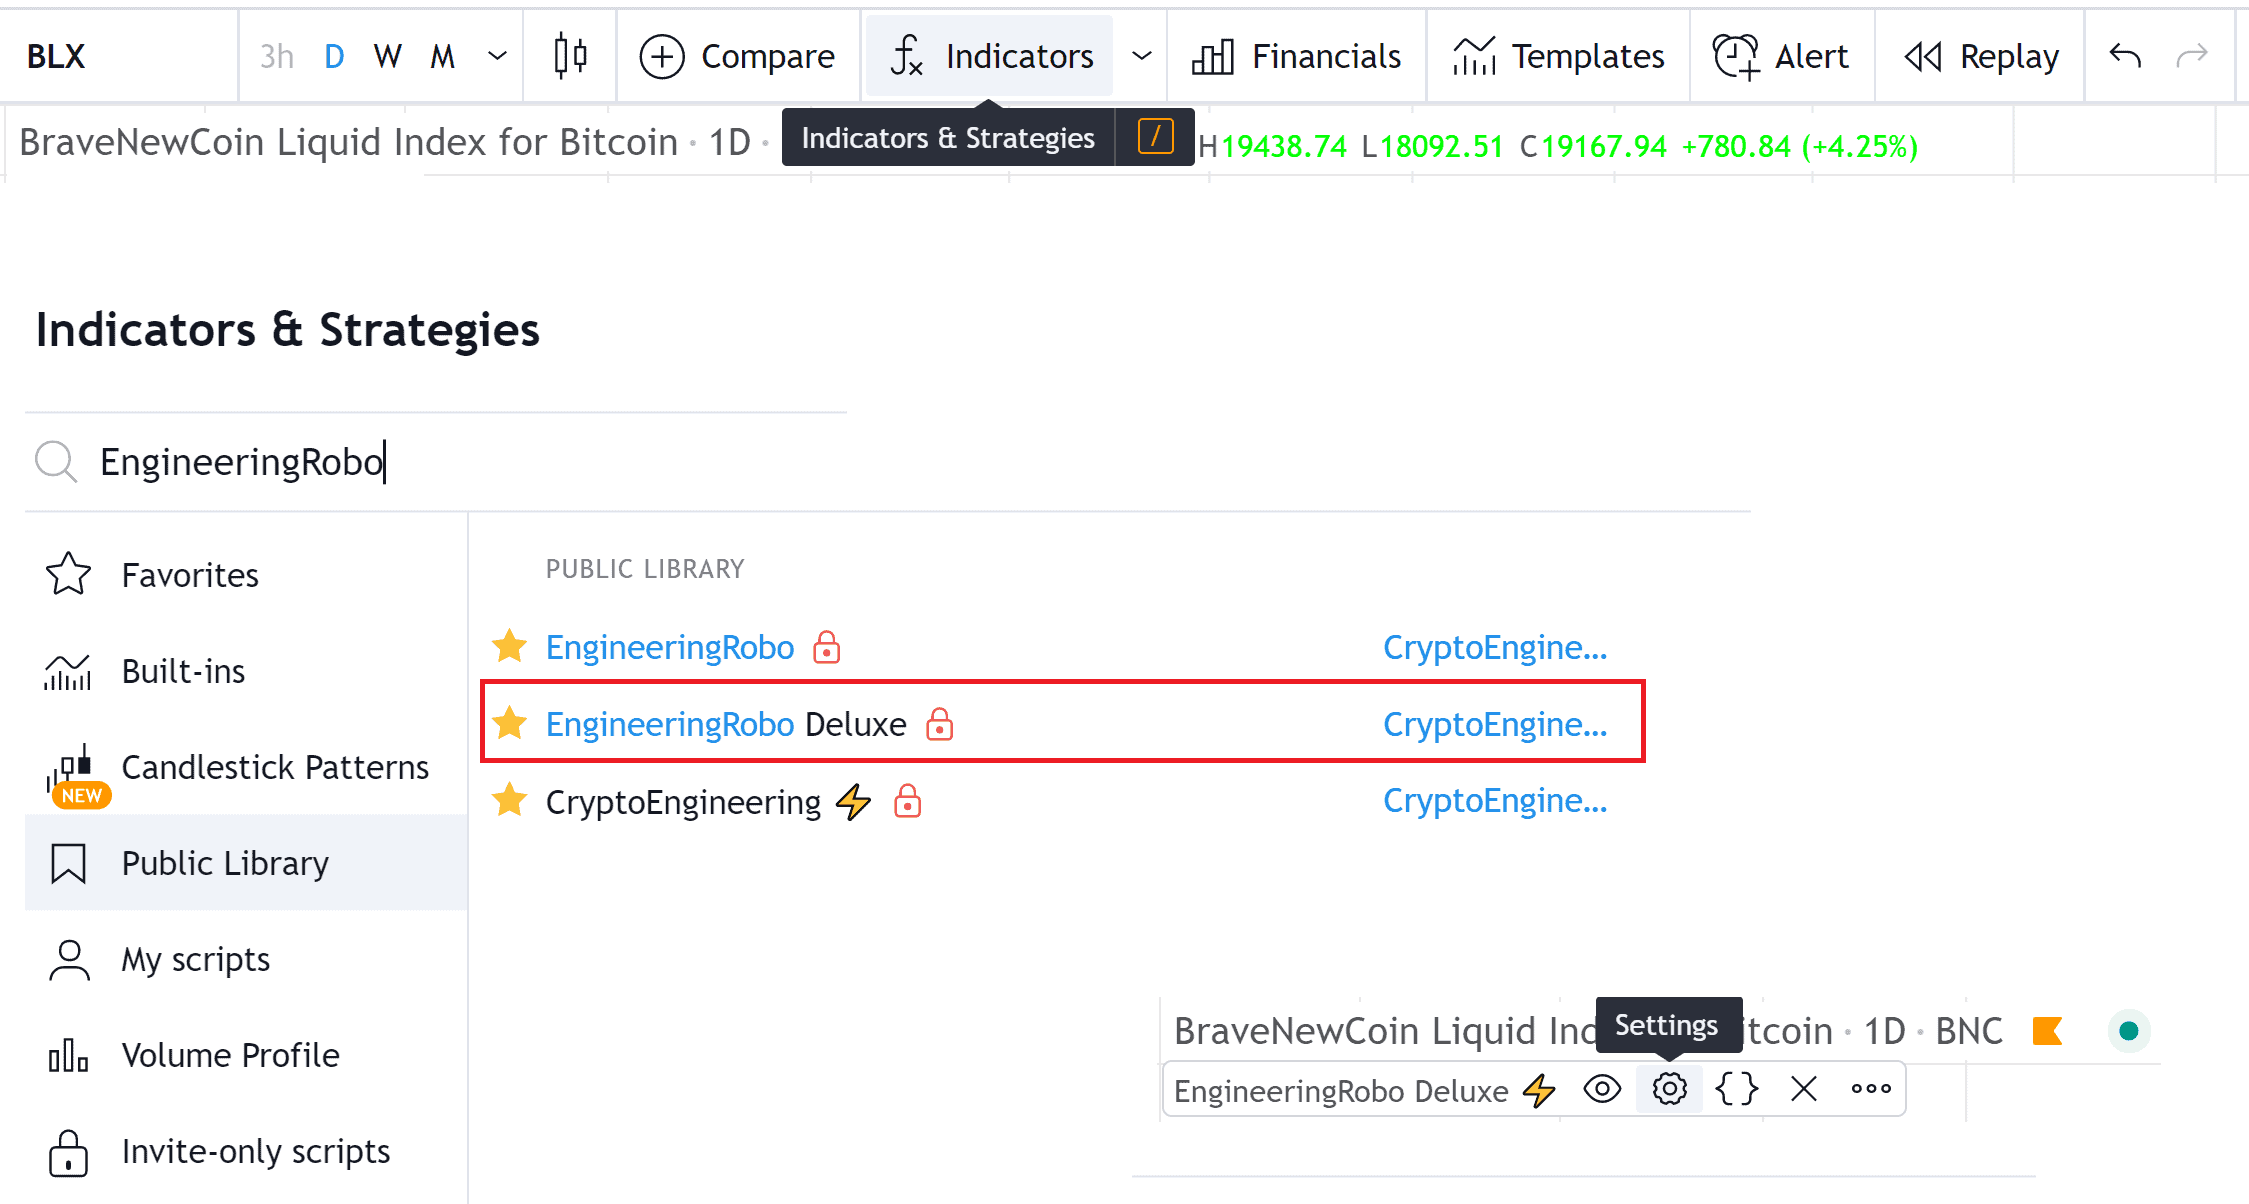
3. Select “Indicators” on the top-center-middle panel
4. In the indicator library, type "EngineeringRobo Deluxe" The indicator will be turned to Premium version after It is approved by EngineeringRobo Team. Please " contact " us if you have any issues
5. After you are approved by EngineeringRobo Team, you can start using robo advisors for 24/7
2. From the homepage, click on ‘Chart’ in the top navigation bar
3. Select “Indicators” on the top-center-middle panel
4. In the indicator library, type "EngineeringRobo Deluxe" The indicator will be turned to Premium version after It is approved by EngineeringRobo Team. Please " contact " us if you have any issues
5. After you are approved by EngineeringRobo Team, you can start using robo advisors for 24/7
4. In the indicator library, type "EngineeringRobo Deluxe" The indicator will be turned to Premium version after It is approved by EngineeringRobo Team. Please " contact " us if you have any issues
5. After you are approved by EngineeringRobo Team, you can start using robo advisors for 24/7
5. After you are approved by EngineeringRobo Team, you can start using robo advisors for 24/7
After you get approved by EngineeringRobo Team, you might see some numbers beside "EngineeringRobo Premium" .
Go to chart properties on the top left, the chart setting will pop up, you can click the status line. Remove the check mark on the Indicator Arguments & Values. Easy and Clean!
Beside " EngineeringRobo Premium" There are " Hide & Settings" buttons.
When you click on the settings, you can open or close any indicators on the inputs.
Engineering Robo Deluxe is an "Invite-Paid- only" indicator that can be added to any chart on tradingview.
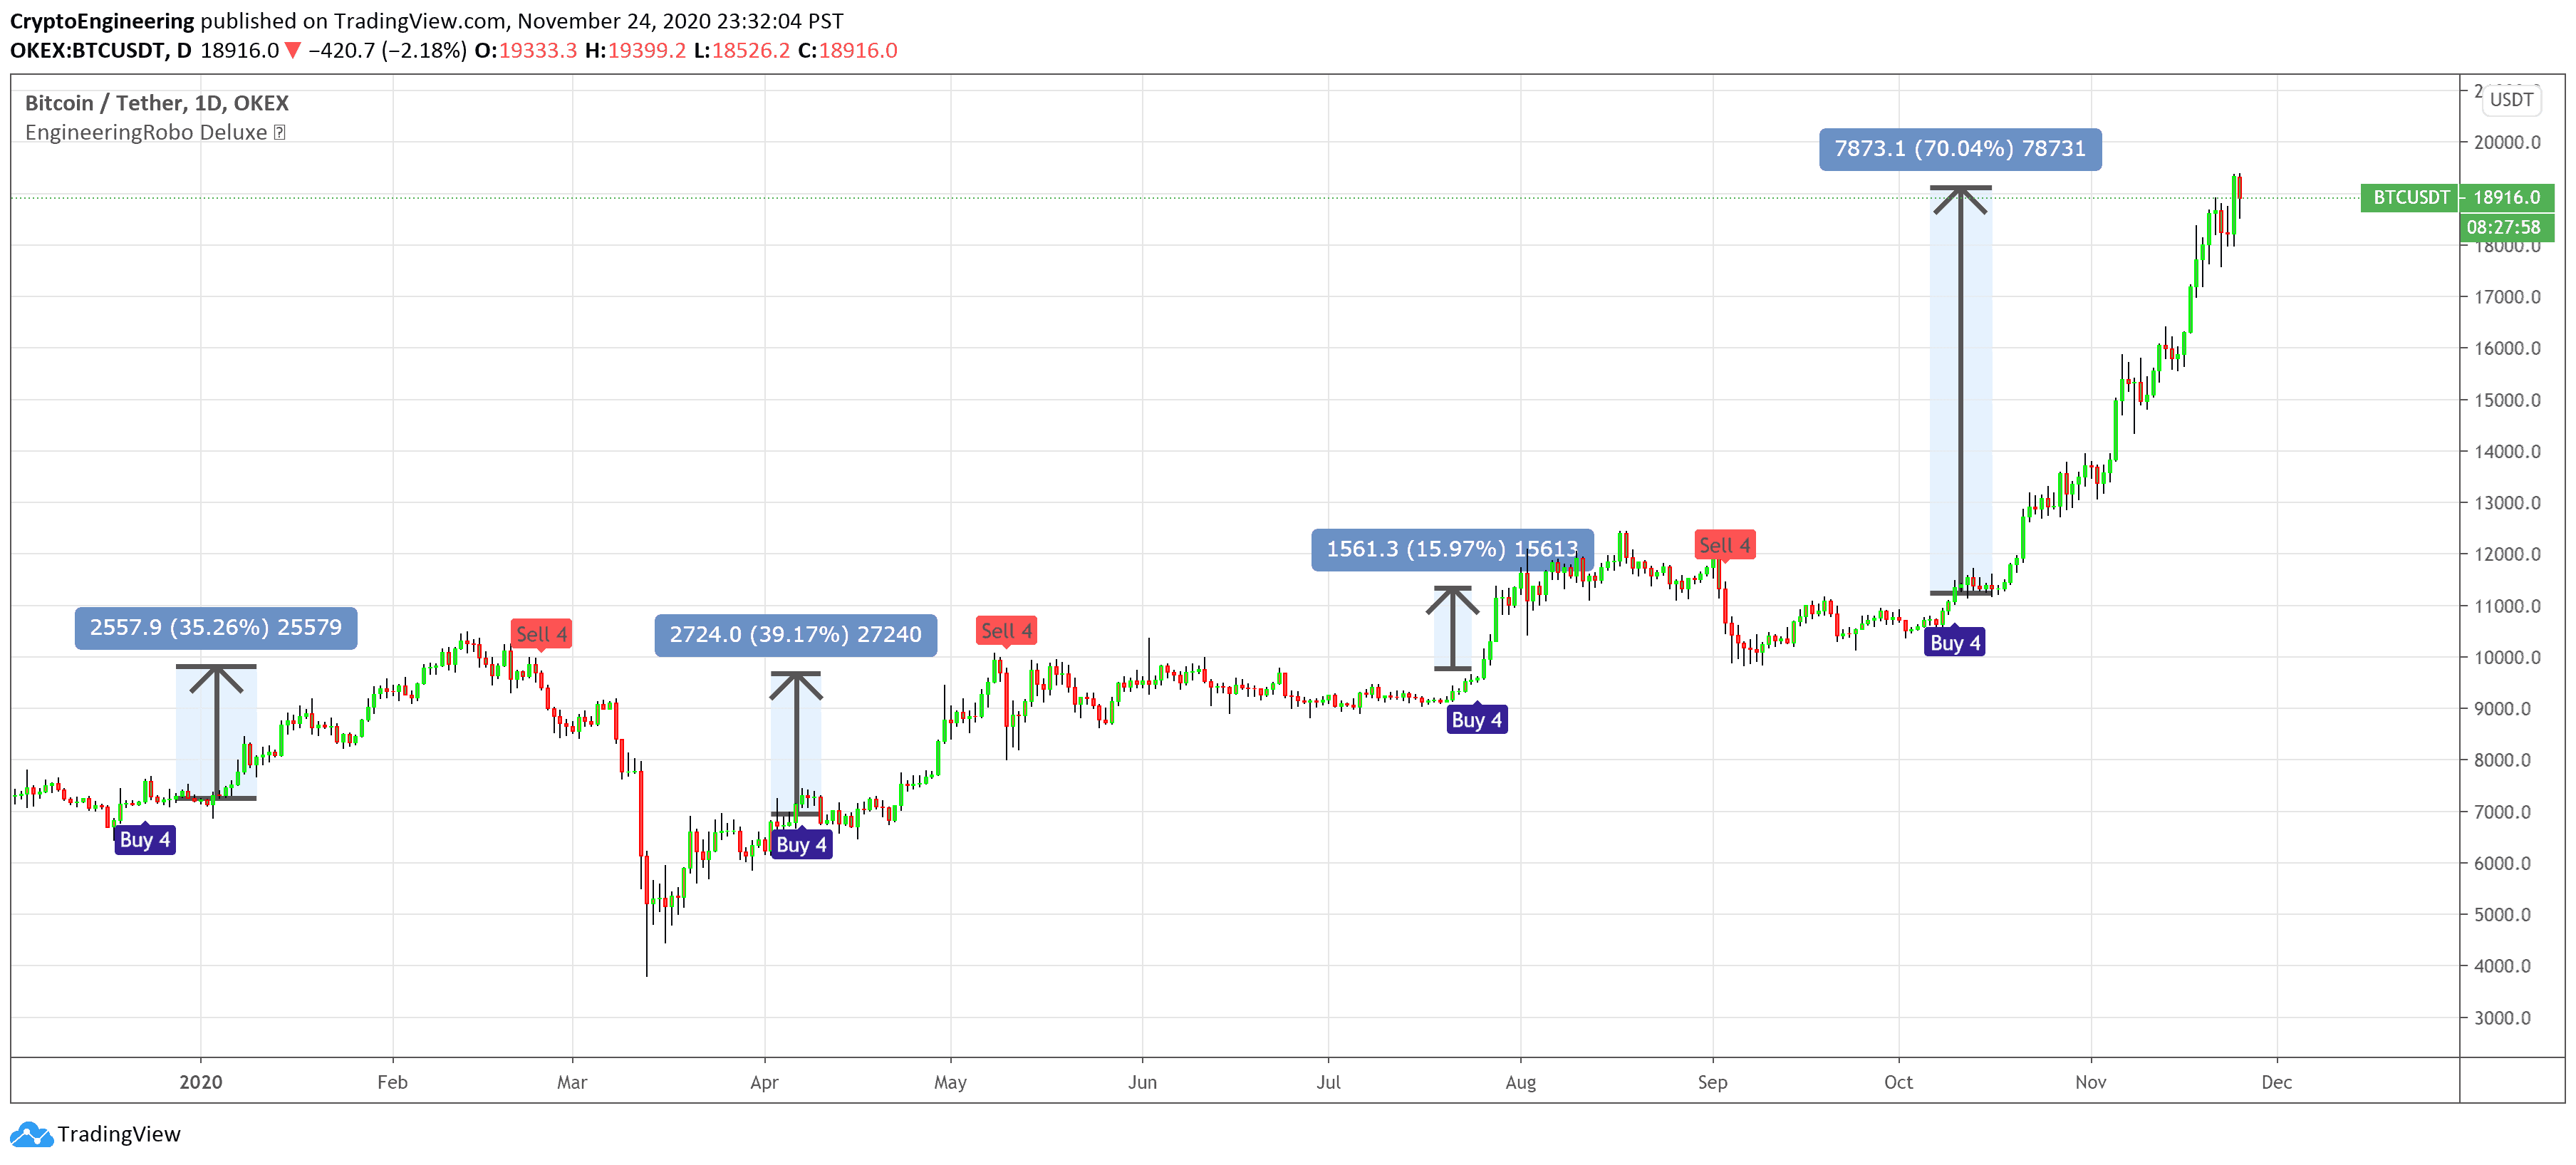
🔵 EngineeringRobo 4
It offers strategic trading entry and exit points, so you can preserve capital before markets tumble, and take full advantage as they start to rebound. At a glance, market timing indicators tell investors whether market conditions are right or whether it’s safer on the sideline.
Truly unique tool for technical analysis for the financial market as it includes calculation of specific metrics like SAR + MACD + Price Movement.
You no longer have to worry about spending hours in front of the computer looking for a trade.You can use the indicator on every assets available on your broker.
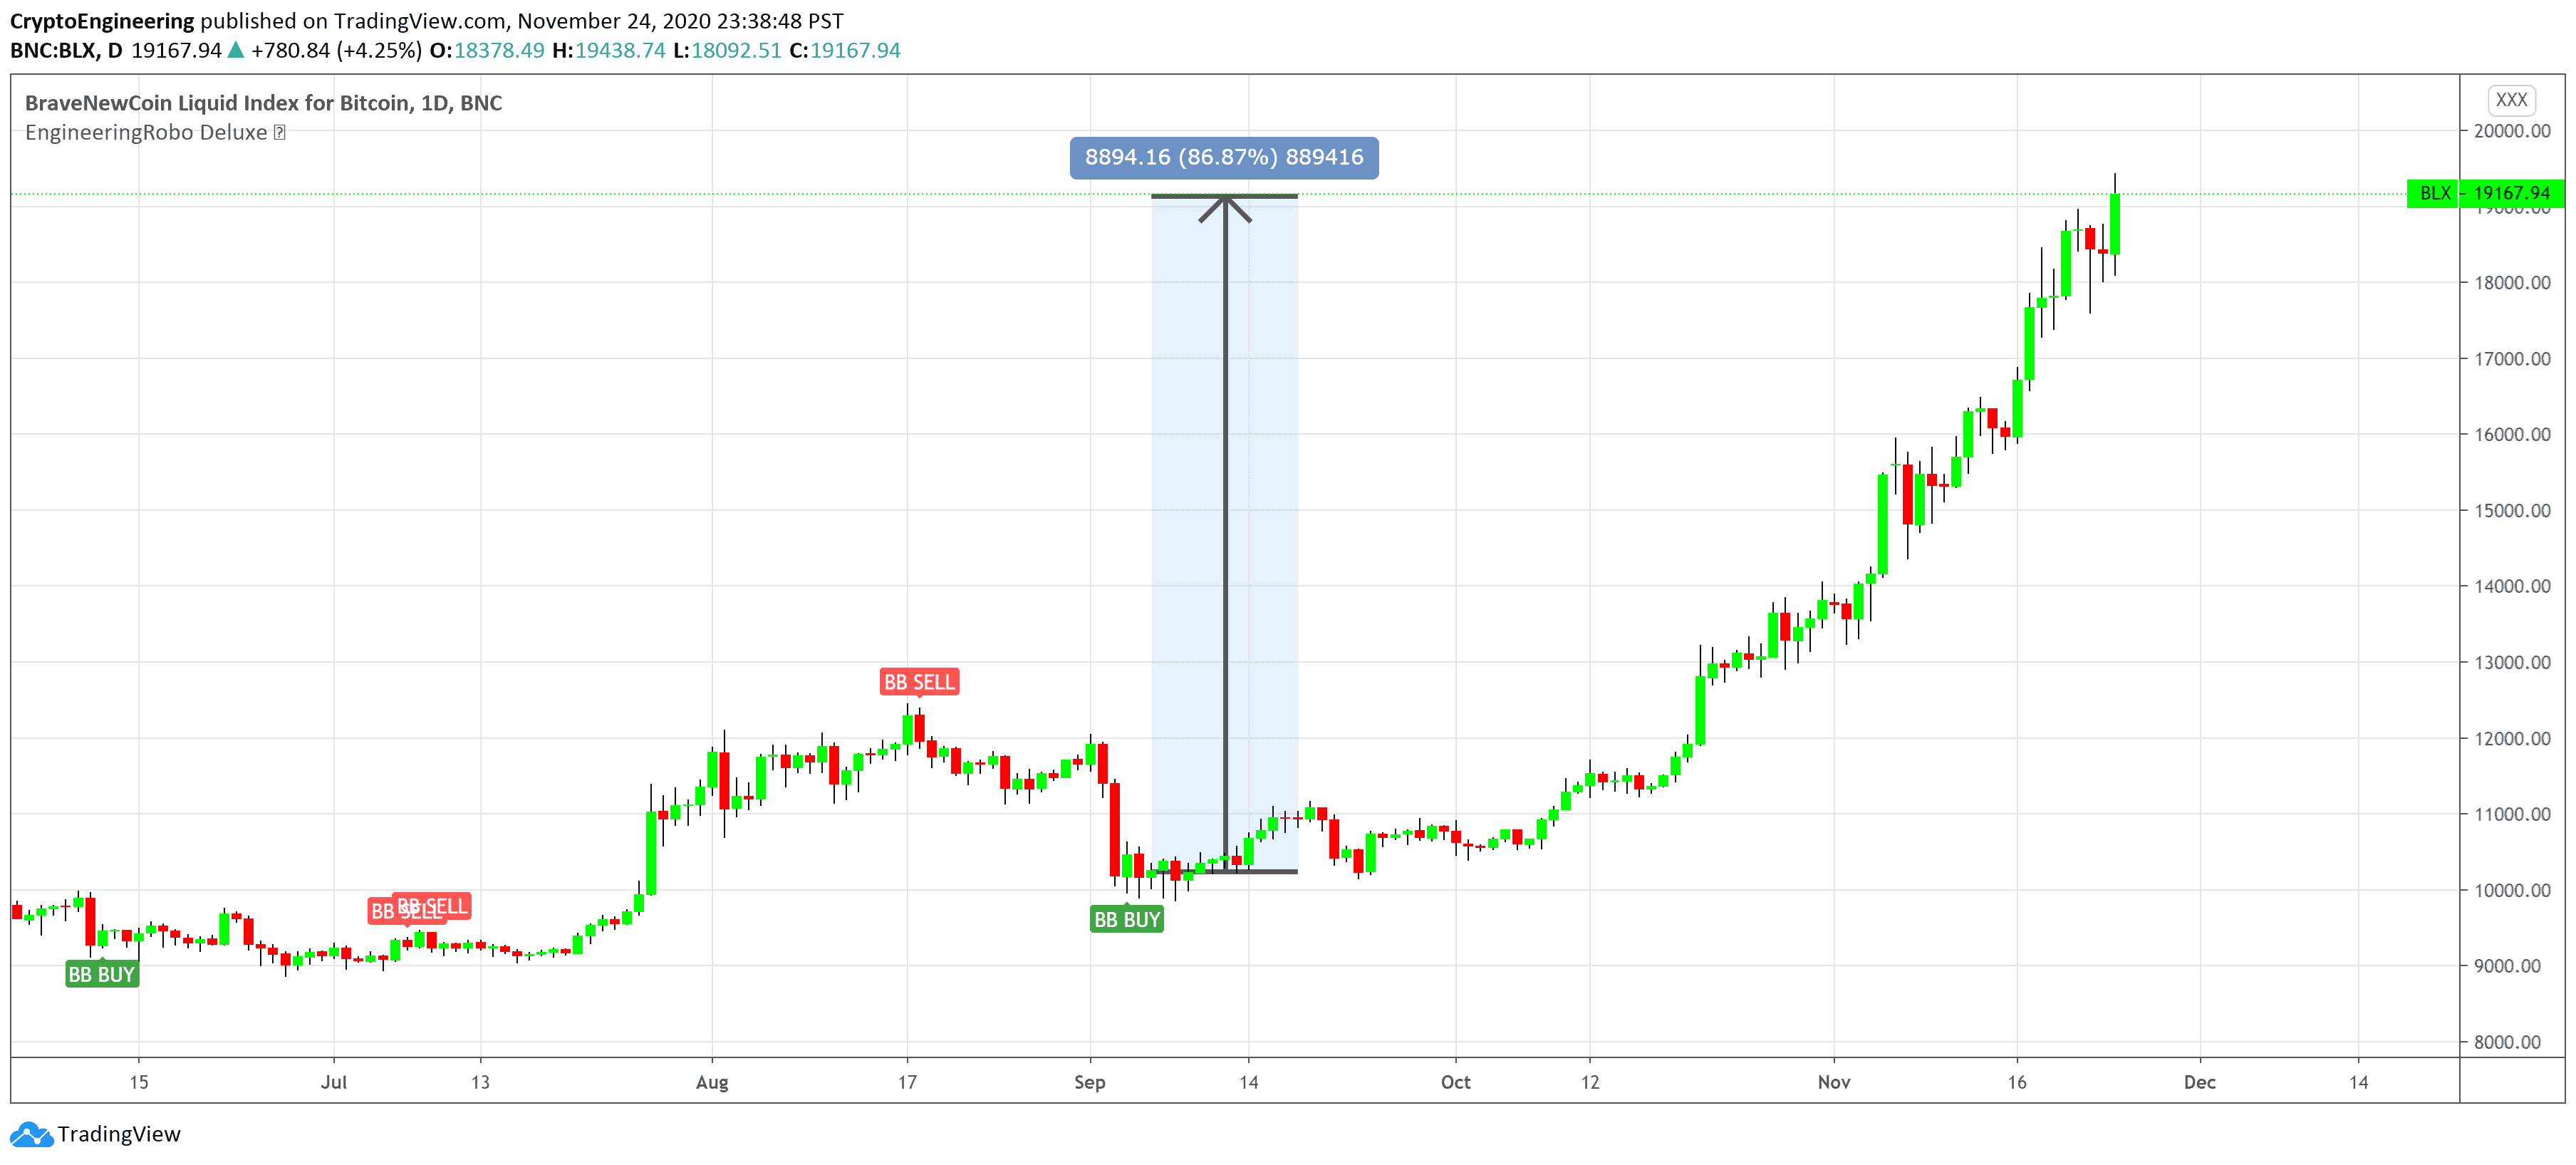
🔵 BB Signals :
This strategy uses the MACD indicator together with the Bollinger Bands to sell when the price is above the upper Bollinger Band (and to buy when this value is below the lower band). This simple strategy only triggers when both the MACD and the Bollinger Band indicators are at the same time in a overbought or oversold condition.
Removed Upper & Lower bands & SMA20 from the charts.
To see bands, You can activate the Bollinger Bands on EngineeringRobo - not the Deluxe version.
If you are buying it with BB BUY, No need to wait for BB Sell to sell it. Vice versa.
They are not the opposite to each other. Get your profit at your target level and move on.

🔵Change Candle Color
How many times did you scare to buy Bitcoin after EngineeringRobo gave buy signals since October 10 when Bitcoin was around $11,000 ?
How many times did you panic sell because of the red candles?
How many times did you hesitate to buy during the red candles?
Do you think the color of a candle or bar affects certain people when trading? Here are two charts, one a standard red/green candle, and the other with EngineeringRobo's candle color option.
Imagine that you had placed a buy order at your support level and that you were looking to buy at or near the line. Would you have found it more difficult to buy if you saw the big red down candles?
Is it easier to buy after EngineeringRobo's buy signals (often the best time to buy) if you don't see a lot of red?
Solution? EngineeringRobo's change candle color feature!

🔵 Ultimate MA crossover signals :
As a general guideline,the idea behind trading crossovers is that a short-term moving average above a long-term moving average is an indicator of upward momentum in a stock & crypto , and the opposite is true about a short-term average trading below a long-term average.
For this guideline to be of use, the moving average should have provided insights into trends and trend changes in the past.
Are the settings of SMA 50 & SMA 200 really the best for Golden Cross and Death Cross?
Have you ever tested ROI for MA cross strategies?
Do you think MA 20 and MA 50 are the best pair for traders?
Do you know that Exponential Moving Average ( EMA ) beats the Simple Moving Average ( SMA ) ?
In order to answer these questions we applied some brute mathematical force and tested 1830 different MA combination to find out the best pair through 50 years of data across stock / forex and 5 years of data across crypto markets . We have done the hard work and you get the benefits .
P.S. The oldest date is 1872 on SPCFD:SPX chart on tradingview . Almost 150 years of backtesting is possible from 1872 to 2020!
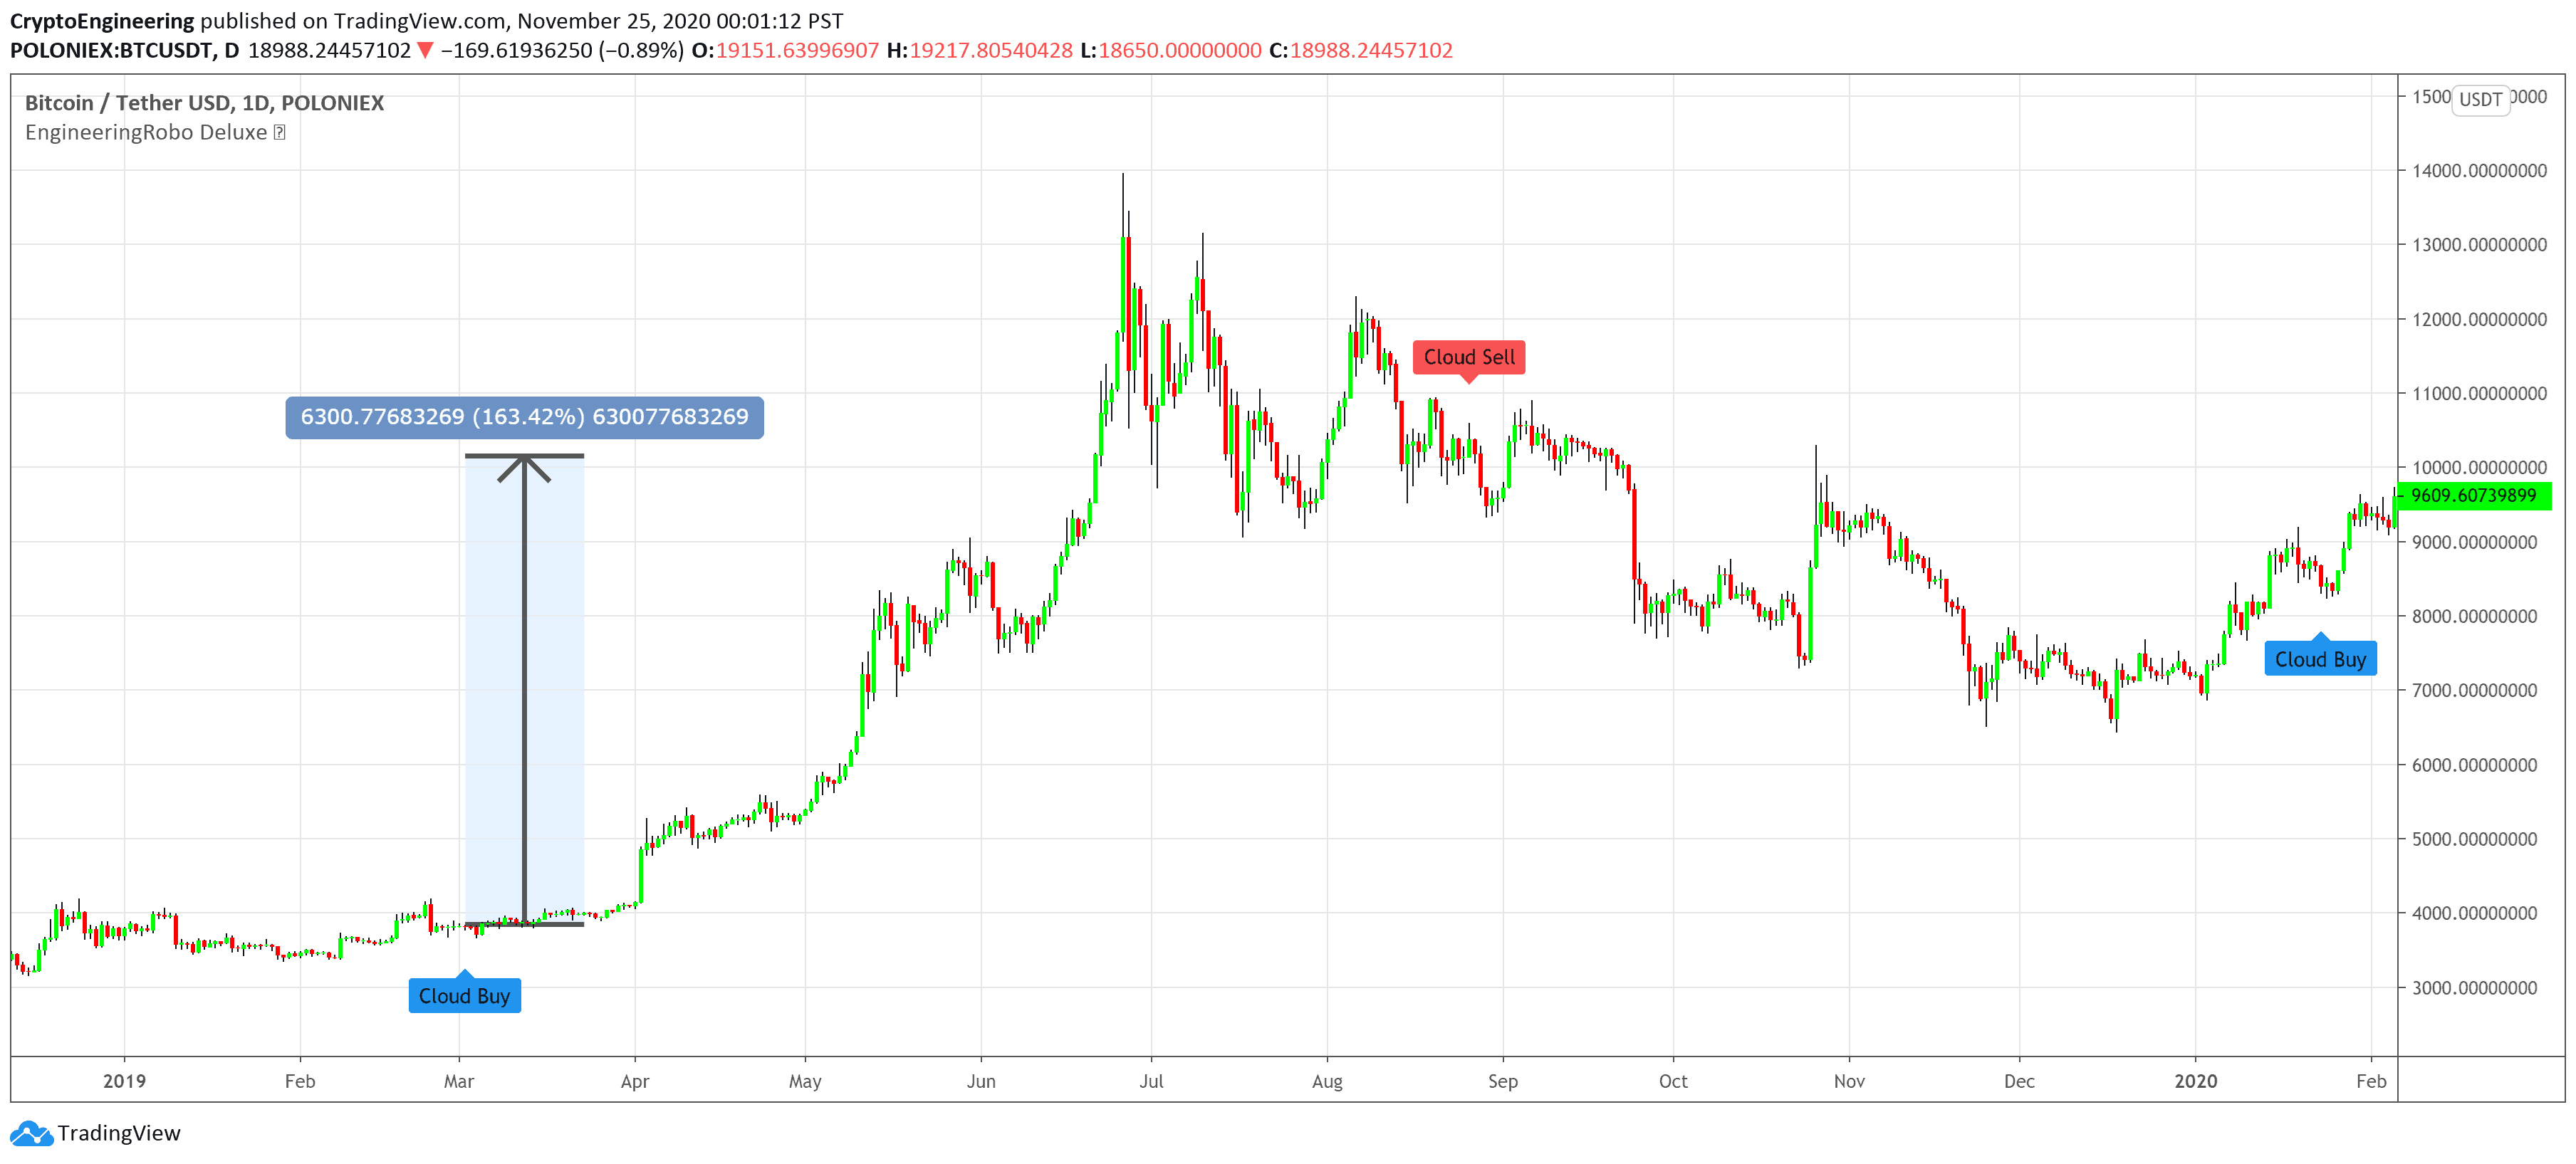
🔵 Cloud Signals :
This is a strategy made from ichimoku cloud , together with MACD . Changed Ichimoku cloud formula. Based on that we have a long or a short entry.
It is an effective strategy when paired with a trailing stop loss. Removed standard line ( Kijun Sen ), turning line ( Tenkan Sen ), lagging line ( Chikou Span ) and senkou lines, added buy & sell signals. Traders can use EngineeringRobo's cloud to see the clouds on the chart.
This method doesn't work in sideways markets, only in volatile trending markets.
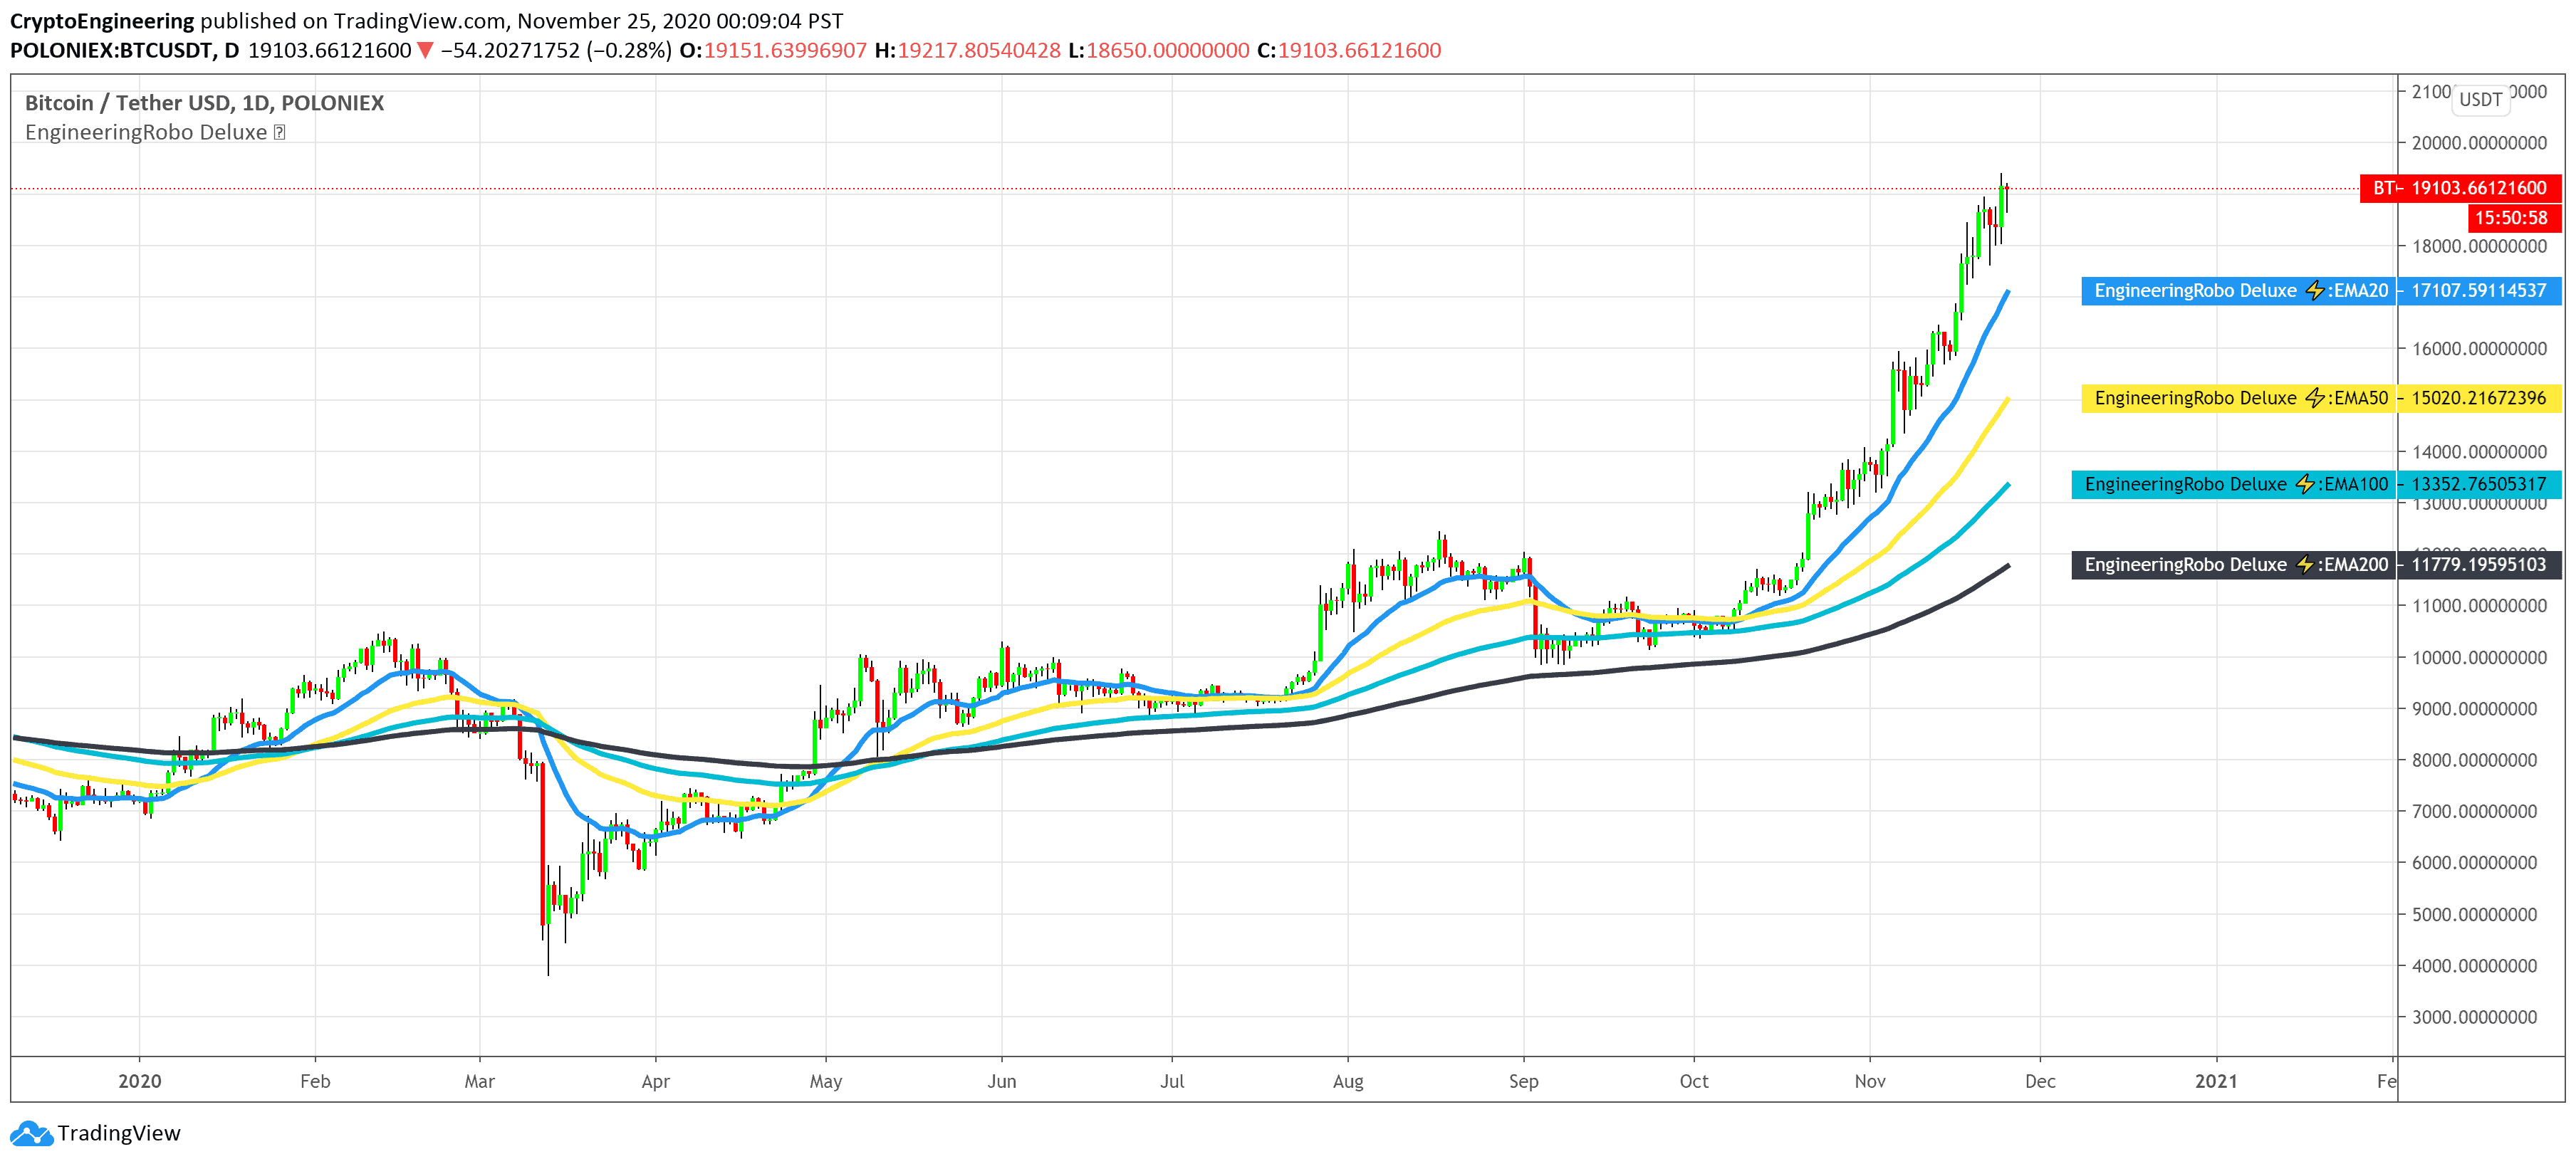
🔵 EMA TrendLines :
Moving averages help traders isolate the trend in a security or market, or the lack of one, and can also signal when a trend may be reversing. Two of the most common types are simple and exponential. We will look at the differences between these two moving averages, helping traders determine which one to use. Simple moving averages and the more complex exponential moving averages help visualize the trend by smoothing out price movements.
Super Bullish : The candle is above MA 20 ( Daily )
Bullish : MA 50 Above MA 100 ( Daily )
Bearish : MA 50 below MA 100 ( Daily )
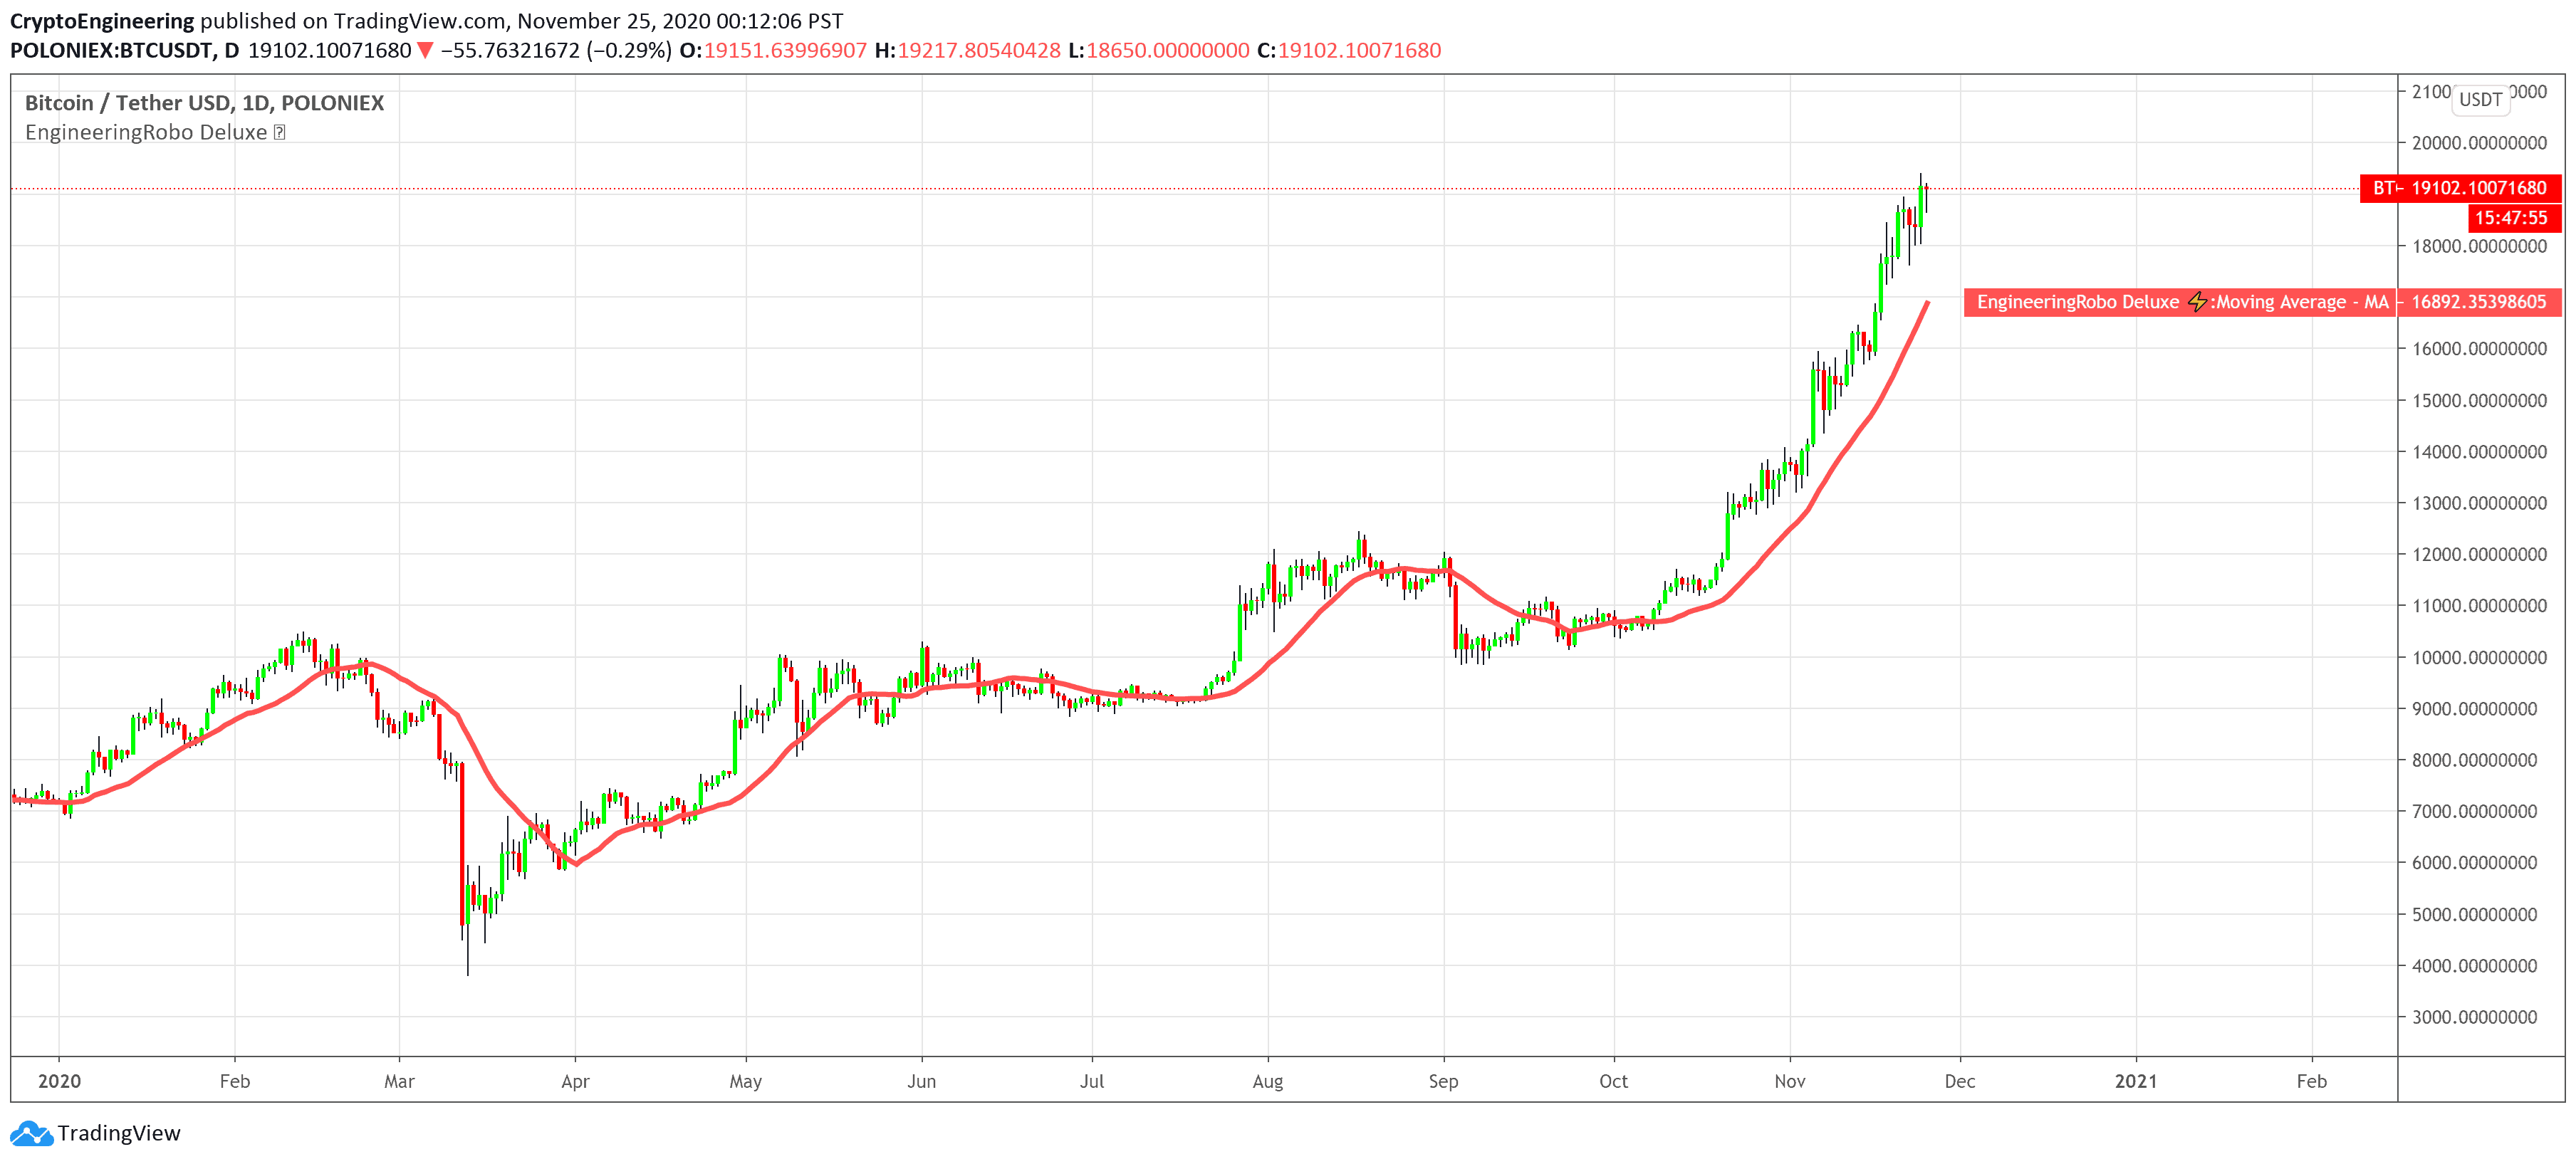
🔵 Custom Moving Average :
Each trader must decide which MA is better for his or her particular strategy. Many shorter-term traders use EMAs because they want to be alerted as soon as the price is moving the other way. Longer-term traders tend to rely on SMAs since these investors aren't rushing to act and prefer to be less actively engaged in their trades.
Trend reversal (downtrend to uptrend) - MA 50 crossover MA 200 from below.
Trend reversal (uptrend to downtrend) - MA 50 crossover MA 200 from above.
Weekly open –close above MA 20 ( bullish trend )
Weekly open –close below MA 50 ( Bearish trend )

If you look at the dashboard, you can see sections for different timeframes:
1W (Weekly), 1D (Daily), 3H (3 hours), 45M (45 minutes), 15M (15 minutes), and Multi-TimeFrame.
Depending on EngineeringRobo AI signals, we give bullish, neutral, and bearish conditions for those timeframes.
In the settings of EngineeringRobo AI, the Multi-TimeFrame is set to "CHART," which means it displays the timeframe selected on the chart screen.
If we select the 3H timeframe on the chart, the Multi-TimeFrame also displayed the 3H conditions (as long as it is in the default section).
If we change the "Chart" section to 5M in the settings, the Multi-TimeFrame shows the 5M conditions, regardless of the selection on the chart. So, you will able to see 1W, 1D, 3H, 45M, 15M, and 5M signals at the same time.
RSI is a momentum-based oscillator that measures the speed and change of price movements. The oscillator ranges from the values of 0 to 100 and this assists traders to identify overbought and oversold conditions.
Overbought
When the RSI surpasses the value of 70, it suggests that an asset may be overbought, and in turn a reversal or correction could be imminent.
Oversold
Conversely, when the RSI drops below the value of 30, which indicates that an asset may be oversold, therefore signaling a buying opportunity.
EngineeringRobo AI Dashboard also provide RSI feature to the traders.
Do NOT forget that RSI can stay overbought / oversold for weeks!
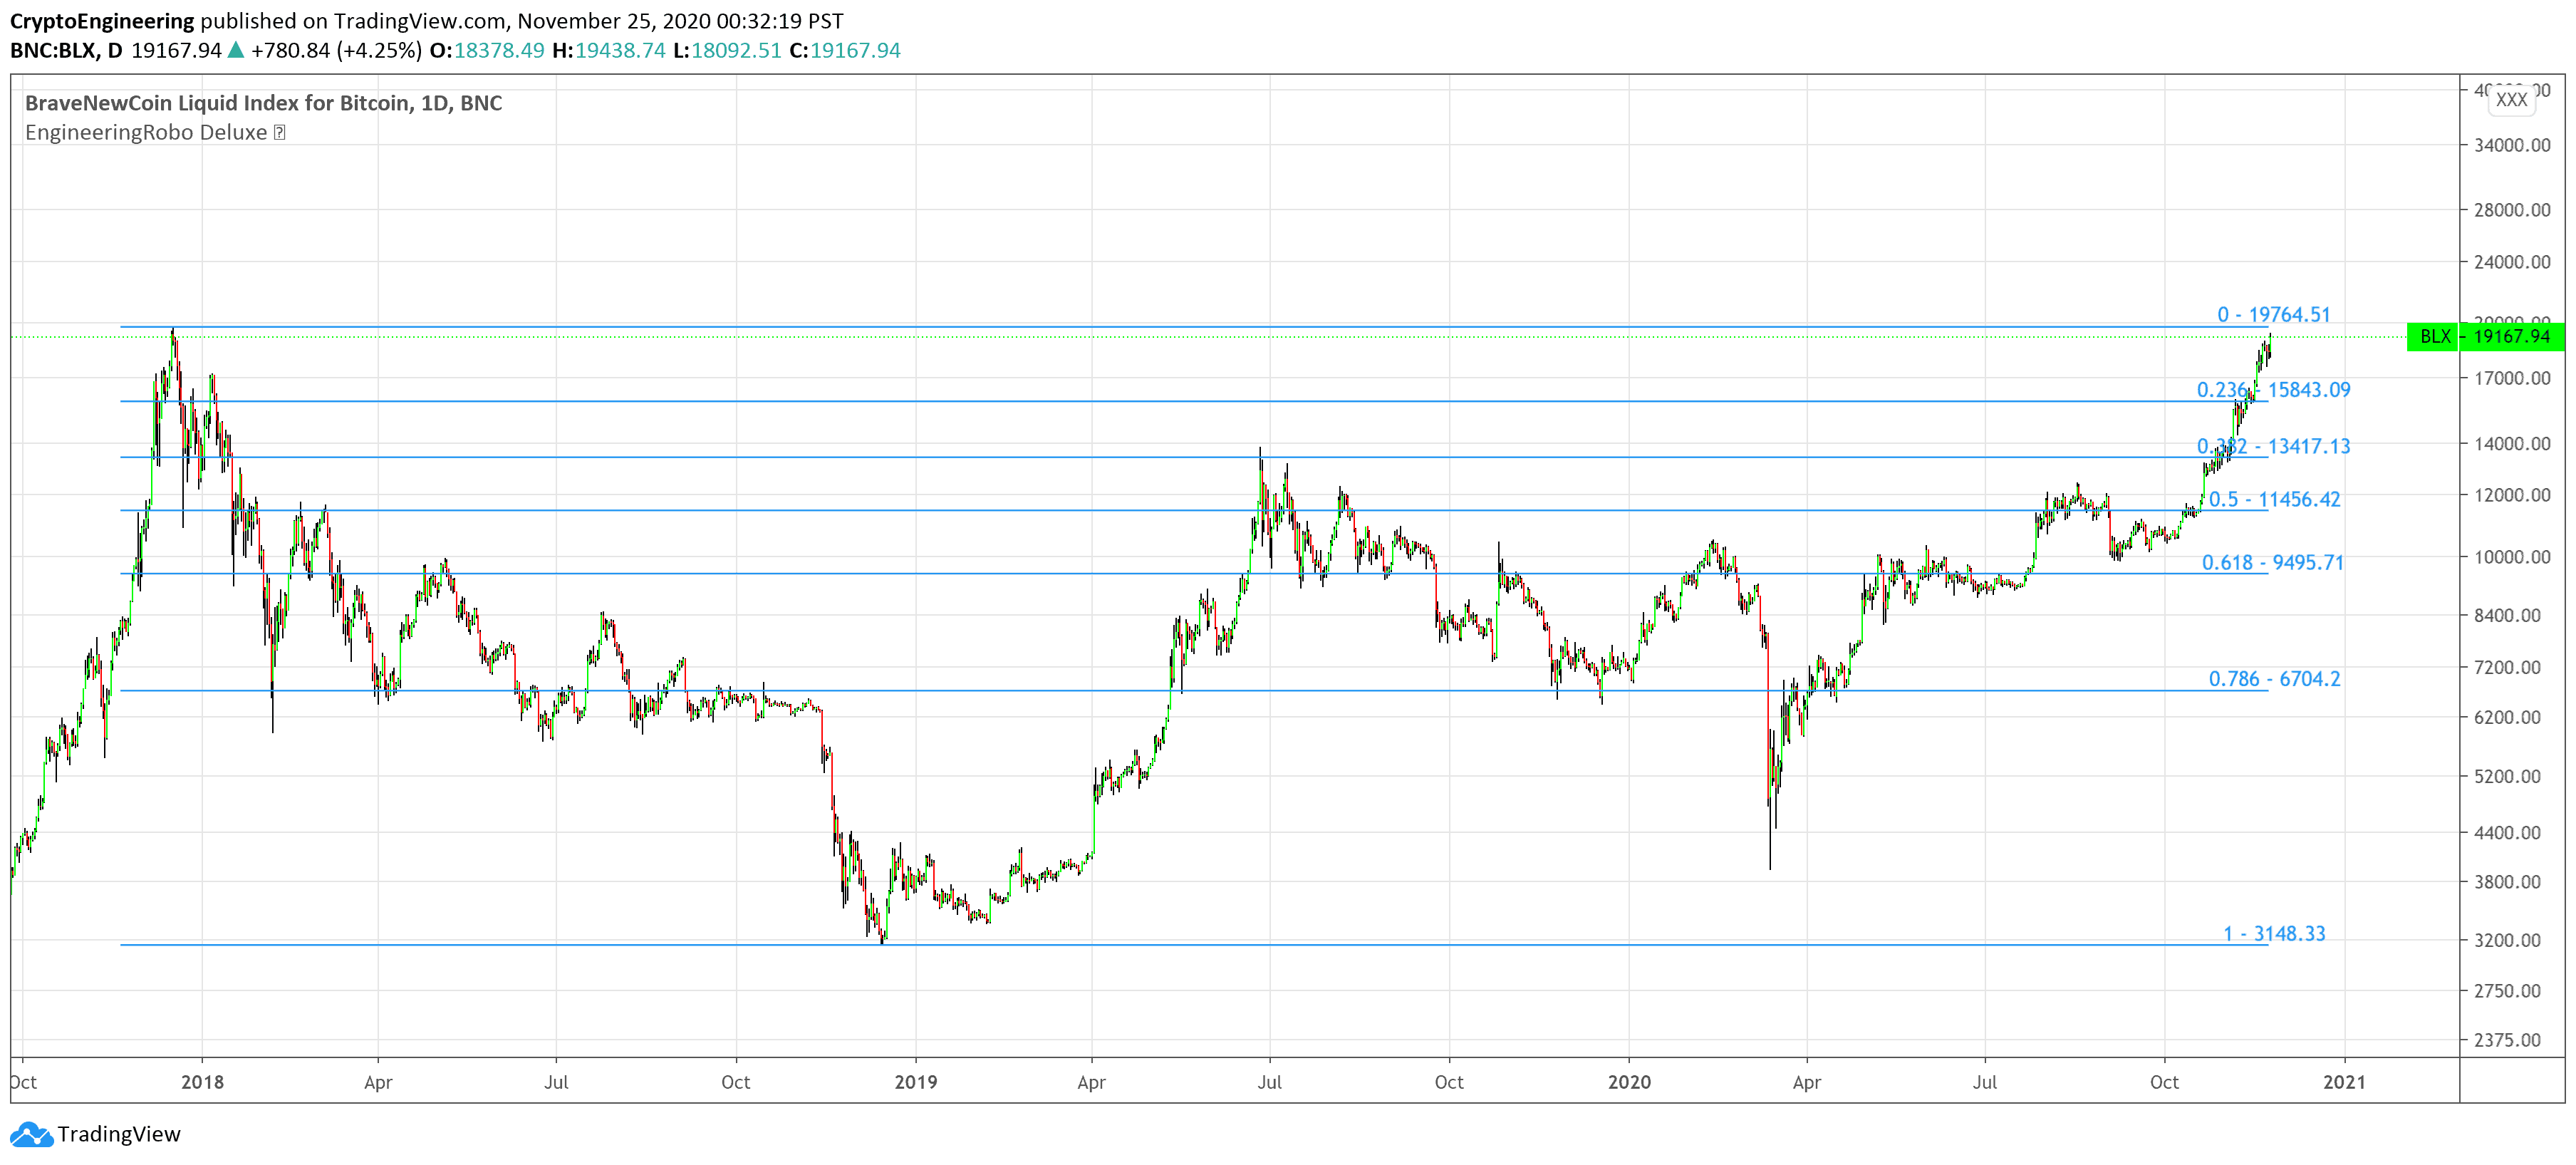
🔵 Automated Fibonacci Retracements
Automatic Fibonacci let you replace subjective manual analysis with objective automated analysis so you always get the best Fibonacci levels, this can really improve the quality of your trading decisions.
Fibonacci retracements are often used to identify the end of a correction or a counter-trend bounce. Corrections and counter-trend bounces often retrace a portion of the prior move. While short 23.6% retracements do occur, the 38.2-61.8% zone covers the most possibilities (with 50% in the middle). This zone may seem big, but it is just a reversal alert zone. One of the best ways to use the Fibonacci retracement tool is to spot potential support and resistance levels and see if they line up with Fibonacci retracement levels.
If you are following any EngineeringRobo Deluxe & Premium signals, you should always wait for the candle close before buying or selling.
The signal can come and go anytime during the live candle. ALL indicators do that, that is not considered repainting.
Repainting is when a signal appears, the candle is closed, and when you refresh the chart it disappeared. It is logical that until the candle is closed the signal is not decided yet, hence the alert setup as Once per bar Close.
Deluxe never repaints! Yes, you heard it right: you will never have to worry about signal changing after the candle is closed.
Added alarm system alerts for all signals.
__________________________Timeframes_______________________________________
Our recommendations to get the best results:
Swing Trading Crypto : Use 1D Time Frame Candles
Swing Trading Stocks : Use 1W Time Frame Candles
Swing Trading Commodities : Use 1W Time Frame Candles
Day Trading Crypto : Use 45M- 3H Time Frame Candles
Day Trading Stocks : Use 1D Time Frame Candles
Day Trading Commodities : Use 1D Time Frame Candles
Not recommended any other time frames.
What Is Risk-Reward Ratio RRR?
Your risk-reward ratio is how much you risk per trade, relative to how much you expect to make (reward).
When trading with Robo , you should always aim for a bigger reward compared to your risk per trade.
A good rule is only to risk 1% per trade for day traders and 5% per trade for swing trader . Robo follows strong risk management rules on the algorithm .
One of the biggest advantages of algo trading is removing human emotion from the financial markets,humans trading are susceptible to emotions that lead to irrational decisions. Robo doesn't have to think or feel good to make a trade. If conditions are met, it enters.When the trade goes the wrong way or hits a profit target, It exits. It doesn't get angry at the market or feel invincible after making a few good trades.
EngineeringRobo gives you all the tools and information you need for day-to-day trading and investing, while also keeping a great buy and sell signals! No excuse to lose in any financial market anymore! Try now!

AI Social Intelligence Score
One of the core features of the EngineeringRobo dashboard are the social and on- chain analysis insights. This enables dashboard users to spot specific coins that could witness significant movements in price under EngineeringRobo AI score.
For example, there could be an abnormally large amount of buzz that signal socio-cultural changes in the Web3 community. These metrics can track cultural trends throughout platforms such as Twitter and Reddit.
EngineeringRobo AI Score track how active specific token/stock discussions are, how widespread discussions are, and even how frequently the asset repository is getting updates pushed to it.
Features:
• Stock/Token activity on social media
• Sentiment of token activity
• Developer activity for a project on GitHub ( for some )
👉 How to read it?
Green 5 : Market is so positive
Green 4 : Market is positive
Green 3 : Market is somewhat positive
Red 3 : Market is somewhat negative
Red 4: Market is negative
Red 5 : Market is so negative
-------------------------------------------
To attempt to measure the AI Social Intelligence Score, we need to gather raw information from various sources. Then, we apply sentiment analysis and machine learning algorithms to derive trading signals.
Raw information sources include:
* News articles
* Twitter feeds
* Reddit posts
* Other social media feeds
* Forum threads
* GitHub repository activity
For example:
SentimentConfidence { id=’5a53bc72ca3ec40fb2bd9bbd’, ticker=’ETH’, positiveSentiment=60.0, negativeSentiment=20.0, neutralSentiment=20.0, compoundSentiment=100.0, numberOfSamples=757 }] = "🟢 Green 3"
In the case above, the system has determined that at that specific moment in time, after analyzing 757 samples of discrete data, Ethereum has an overall positive sentiment — with a 60% degree of confidence. We then repeat this process for all other cryptocurrencies we want to analyze. We track sentiment changes in real-time, giving a rating from green 5 to red 5 for ETH, as follows:
👉 How to interpret it?
Green 5: Public sentiment for ETH is highly positive.
Green 4: Public sentiment for ETH is positive.
Green 3: Public sentiment for ETH is somewhat positive.
Red 3: Public sentiment for ETH is somewhat negative.
Red 4: Public sentiment for ETH is negative.
Red 5: Public sentiment for ETH is highly negative.

Best Buy & Best Sell Levels Powered by Artificial Intelligence ( AI ) Technology
This strategy finds the TOP AREA OF THE BULL MARKET AND THE BOTTOM AREA OF THE BEAR MARKET. It is one of the best indicator for crypto traders!
CHECK IT ONCE A WEEK!
1. Use the indicator to identify when investors are greedy
2. Use the indicator to identify potential bottom levels
For a case study:
👉 Type BTCUSDT on search box on tradingview
👉 Select " Bitcoin All Time History Index "
👉 Chose 1D Time Frame
👉 Activate EngineeringRobo AI
👉 Only pick " BEST BUY - BEST SELL LEVELS " for Investors
Price crosses above red line= Entering overbought zone
Price crosses below red line= Exiting overbought zone ( Generally Bear Market confirmation )
Price crosses below green line= Entering oversold zone
Price crosses above green line = Exiting oversold zone ( Generally Bull Market confirmation )
__
BEST TIME TO SELL: When the candle is inside & exiting the Red Area
BEST TIME TO BUY: When the candle is in the Green Area


At the peak of the 2021 Bull Market, the candlesticks touched the overbought line. If you zoom in a bit, you'll notice the small red zone there.
So, AI-powered Best Buy - Best Sell Levels have provided us with amazing signals since the beginning of Bitcoin chart.
Based on the recent green zone levels, the bull market started at around the $29K level on Oct 16, 2023.
The current chart suggests that BITCOIN will reach at least $200,000 before the end of the bull market by 2026! 🚀
This startegy has been giving 100% success rate since the beginning of Bitcoin chart.